

![]()
The new Betmix Bird Dog handicapping screen will give you much more control over how you handicap, allow you to customize your display and provide you with all the data you need to make the best handicapping decisions possible.
Options
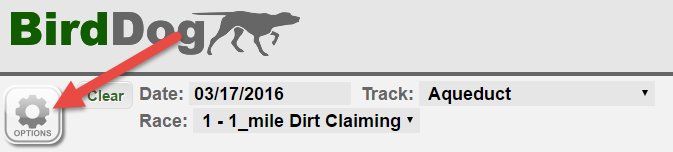
Clicking the options icon will bring up a menu that will allow you to choose which widgets are shown on the screen and which color theme you want (light or dark). You can also choose from some preset display options (Minimalist, Professional, Standard or Default).
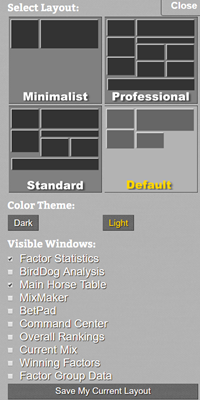
You also have the ability to drag and drop the widgets around on your screen. Some widgets are full width, and can only be kept in certain spots but the majority of widgets can be moved around to a place on the screen that you want them.
At the bottom of the options menu you will see a button called “Save My Current Layout”. When you click that button all of your options will be saved and the next time you open up Bird Dog your layout will be the same – the widgets you have selected, the color theme as well as the location on the screen of the widgets.
Main Horse Table
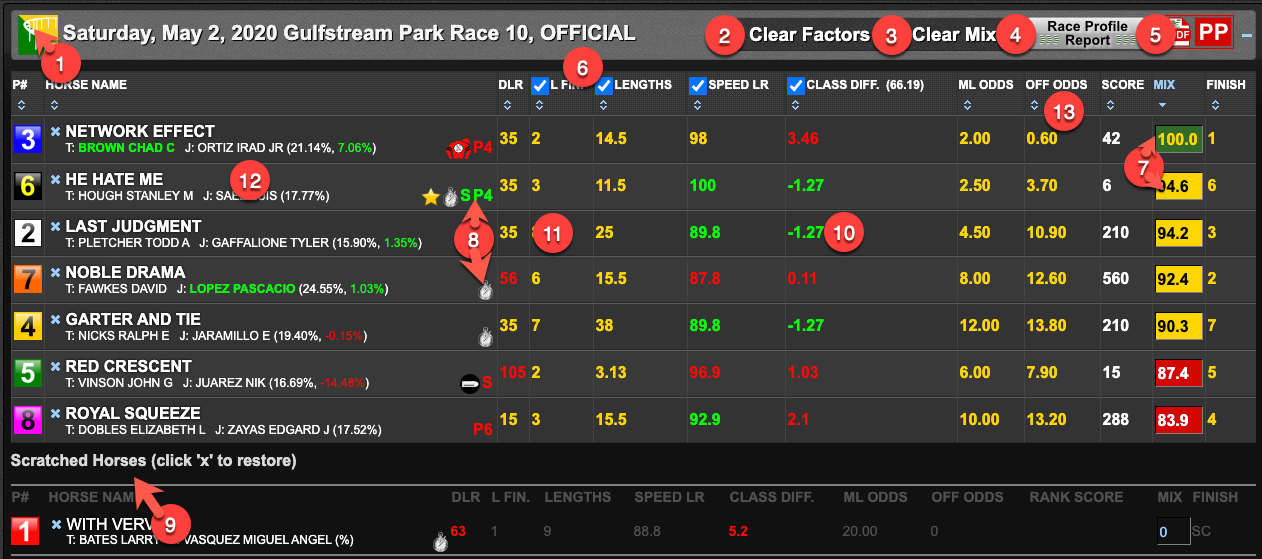
- Mouse over the track icon for a detailed description of the race conditions.
- The Clear Factors button will remove any factors that you have added to the table. You can add factors to the table by clicking the “+” icon in the Factor Statistics table.
- The Clear Mix button clears out any mix you have added, or the factors you have added to your mix by using the sliders in the table.
- The Race Profile Report button will launch a new window showing you all similar previous races.
- The Download PP Button will download the printable PP (PDF Format)
- The default factors used in the table have a check box next to them. Removing the check will remove that factor from the score total.
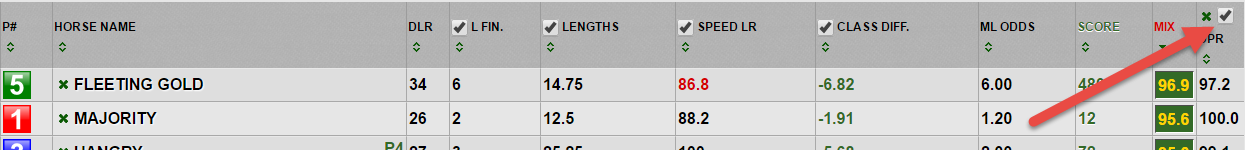
LAST FINISH – This is the last finish position for the horse
LENGTHS – This is the combined number of lengths the horse has been beaten in its previous 3 races.
SPEED LR – This is the relative speed for the horse’s last race. The horse with the highest speed figure in its last races would have a score of 100. Every other horse is some % of that top score.
Green Speed Figure means that the last race speed figure earned was at the same distance and surface as today’s race. Red Speed Figure means that the last race speed figure earned was on a different surface than today’s track or the last race was more than a furlong (1/8 mile) different than today’s race.Black or Yellow Speed Figure means that the last race speed figure earned was on the same surface but within a furlong of today’s race. Black speed figures will show up on the light theme, and Yellow speed figures if you are using the dark theme.
CLASS DIFF. – This tells you if this race is easier (moving down in class) or harder (moving up in class). A negative green number (-1.56) would mean that this upcoming race is easier in terms of quality of horse than the previous race. A positive red number (1.06) would mean that this race is harder than the previous race.
- There are two columns in the horse table for ranking horses. The Score column and the Mix column. The score column is based on the factors that you have added and whether or not you have checked those factors. By default the factors you add are checked. The score is computed by multiplying each horses rank within the different factors. THE LOWER THE BETTER. If a horse was ranked 1st in Last Finish, 1st in Lengths, 3rd in Speed Last Race and 5th in Class difference his score would be (1X1X3X5) for a total of 15. The Mix score is computed by the weight you assigned to each factor and how the horses rank relative to the leader in each factor.
- Some horses will have codes in this column. They represent different things about the horse that you should consider:
S – A green S means that the horse has three consecutive races of improving speed.
S – A red S means that the horse has three consecutive races of declining speed.
F – A green F means that the horse has 3 consecutive races of improving finish position.
F - A red F means that the horse has 3 consecutive races of declining finish position.
? – A question mark indicates that in the last race the horse has some major trouble and did not finish. It could be that the jockey fell off, or the horse was pulled up.
P4, P4 – A green P followed by a number means that the horse has shown a pattern of good finish/bad finish over a number of races. The number indicates how many races have been in the pattern and if it is green that means that this race should be on the good side of the pattern, if it is red then this race is on the bad side of the pattern. There are many reasons that a horse may show an alternating good/bad race pattern and you should take a closer look at the horse to see if the pattern is explainable (higher quality race/lower quality race or maybe dirt/turf, fast track/sloppy track)
Yellow Caution symbol - means that the horse may have had a troubled trip last time out - Horses that you scratch will appear on the bottom. To scratch a horse click the X by its name. To restore it to the race click the x by its name again and it will reappear in the main view. You can scratch a horse because it is truly no longer in the race, or you can use the scratch tool to eliminate horses that you feel are not contenders as part of an “elimination handicapping” method.
- Pay close attention to the Class Difference for each horse. This tells you if this race is easier (moving down in class) or harder (moving up in class). A negative green number (-1.56) would mean that this upcoming race is easier in terms of quality of horse than the previous race. A positive red number (1.06) would mean that this race is harder than the previous race.
- One bad race over the last 3 can really hurt a horse in the Lengths factor. If a horse has a very large number you may want to click on the horse (launches the horse info box) to see if there is a reason. If a horse has a 0 (zero) for a lengths score it means that it has won its last 3 races (was not beaten by any lengths)
- Underneath the horse name you will find the trainer and jockey names. To the right of the jockey name you will see that jockey's 6 month win %. If the jockey riding today is different than the jockey that rode in the previous race you will see a 2nd number which tells you how much better (green) or worse (red) the new jockey's 6 month win % is.
Other Icons
![]()
FACTOR STATISTICS

- The Factors tab lists all of the factors along with stats about each factor
- Winning posts shows the number of races won by horses starting from each post for the race type
- Shows the payouts for similar races in a line graph over time as well as a bar graph of the payouts in different ranges.
- The races tab shows you every race used to compile the statistics. Clicking on a race will open up that race in BirdDog
- O/T Stats gives you information about the horse as well as Owner/Trainer stats (O/T)
Lifetime starts for each horse
Lifetime wins for each horse
Days since last win for each horse
O/T Matches shows you how many times the Owner and Trainer combo have run a horse together
O/T Win % is the win % for the Owner/Trainer combo
O/T Place % is the place % for the Owner/Trainer combo
O/T Show % is the show % for the Owner/Trainer comboThe SPEED button will bring up statistical information about speed factors for the race type along with stats combining certain speed and pace factorsThe XRAY button allows you to highlight a horse across all factors as well as limit the number of factors shown. - The settings button allows you to change the number of races, starters, distance, class, etc for the races used. The more restrictive you are, the fewer races you will find.
SCORING METHODS
There are three different ways to rank horses in Bird Dog. You can use a mix, the score method which is based on rankings within a factor or the Bird Dog ranks which are based on percentages. It is possible that you can get a different ranking using the same factors in each method, and here is the reason: Mixes (a set of factors and weights) will take into account how closely the horses are ranked within in factor. If you look at a factor like speed last race, the horse with the highest speed figure in his last race will have a score of 100. Every other horse will have some percentage of that score.
| MIX SCORING | ||
| HORSE | SPEED LAST RACE | MIX SCORE |
| 2 | 96 | 100 |
| 3 | 93 | 96.9 |
| 5 | 93 | 96.9 |
| 6 | 91 | 94.8 |
| 1 | 90 | 93.8 |
| 4 | 80 | 83.3 |
Horse #2 had the best speed last race with a figure of 96, so every other horses score will be some percentage of the top horse. 93 is 96.9% of 96 so that is the mix score for horses 3 and 5. Horse #4 had the lowest figure for speed last race (80) and earned a mix score of 83.3 since 80 is 83.3% of 96. Using mixes you are awarding horses more for having higher scores in factors and penalizing them less if they are only slightly behind the leader. When you use multiple factors in a mix and apply different weights the difference in scores can be magnified (factors with higher weights) or minimized (factors with lower weights) in the combined mix score. When using mixes the horse with the HIGHEST SCORE IS BEST.
In the main horse table there is a MIX and SCORE column. You can sort by each.
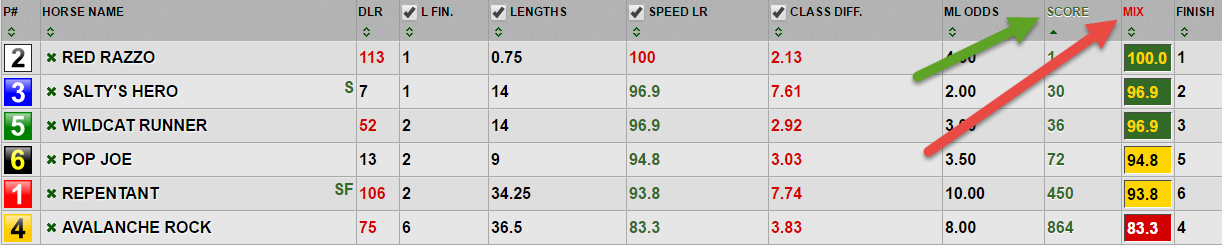
The score column is based on the factors you have added to the main table and is computed by using each horses rank within those factors. In the Score column, the horse with the lowest score is best. The reason for that is that the score is computed by multiplying where a horse is ranked within each factor. In the above example #2 (Red Razzo) is ranked 1st in each factor that we are using. The factors we are using all of check marks by their names. We are using Last Finish, Lengths beaten, Speed Last Race and Class Difference.
#2 Red Razzo gets a score of 1 because he is ranked 1st in each of those factors.
(1x1x1x1=1)
When you look at the bottom ranked horse (#4 Avalanche Rock) his score is 864.
He is ranked 6th in Last Finish, 6th in Lengths Beaten, 6th in Speed Last Race and 4th in Class Difference. When you multiply 6x6x6x4 you get 864. When you look at a race with several horses and are using several factors the rank scores can get very high.
The scoring method takes into account ties. In the above example horses #5 & #3 are tied in Speed Last Race, each of them would have a score of 2 since they are both ranked 2nd within that factor. The actual ranks for that factor would be 1,2,2,4,5,6. There is not a 3rd ranked horse. Horse #6 Pop Joe is ranked 4th because there are 3 horses that are ranked higher than he is.
You can add as many factors as you like to the Main Horse Table by clicking the + button next to the factor name.

When you add a factor to the main table it will become part of the score for that race. You can uncheck a factor you have added and it will still be visible but not part of the score. You can click the X by the factor you have added to remove it completely from the table. Each factor that you add can be sorted so that you can see how the horses rank from top to bottom.
The final way that you can rank horses is using the BirdDog analysis.
The BirdDog table shows you information about each factor across a large number of races. These races are not as specific as those used to compile the stats for the factor table.
In the Factor Statistics table all of the races are from the same track, distance, surface and class. In the BirdDog table we are looking only at same distance, same surface, and same number of starters. The race classes are only maiden or non-maiden.
Take a look at the BirdDog table below:
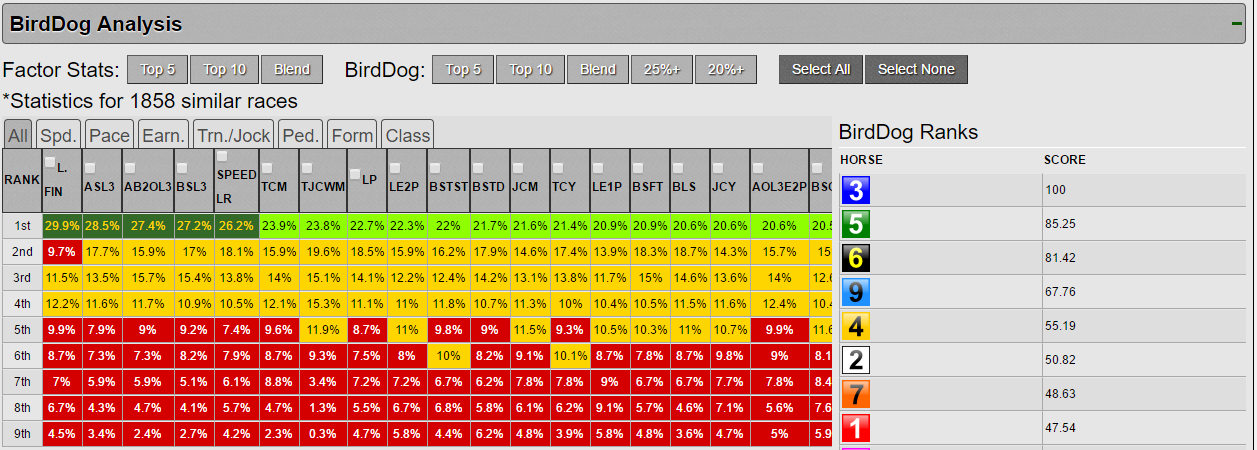
These are stats for a 6f dirt claiming race. We looked at 1858 6f dirt claiming races that had exactly 9 starters. The factors are arranged from best to worst based on what percentage of the time the top ranked horse within a factor wins.
In the above example the first column is Last Finish Position. The top ranked horse has a score of 29.9%. That means that horses that had the best Last Finish Position won 29.9% of all 6f dirt races with 9 starters. In that same column you will see that horses that were ranked 2nd in last finish position won 9.7% of the races. Being ranked 3rd or 4th for that particular factor resulted in higher win percentages than being ranked 2nd. How can that be? There are probably several explanations. The most likely is that horses than ran 2nd might have been all out trying to win, while horses that ran 3rd or 4th in their last starts weren’t pushed as hard. There are a few other logical explanations, but the main point here is to note that things are not always going to be better from top to bottom.
At the bottom of that column you will see that horses that were ranked 9th in Last Finish Position only won 4.5% of the 1858 races used in the sample.
BIRDDOG scoring
There are several buttons at the top of the BirdDog table that you can click to see various rankings. There are Top 5, 10, Blend, etc.
The Factor Stats Top 5 button will use the top 5 factors from the Factor Statistics table, and the Bird Dog Top 5 will use the top 5 factors from the BirdDog table. Remember, the Factor Stats table is much more specific to for the race type.
The Blend buttons use the best factor from each category (Speed, Pace, Earnings, etc.).
The 25% or 20% button will use only the factors where the top ranked horse has a win percentage above 20% or 25%.
When you click a button or pick factors on your own, the scores are computed by taking the average percentages for the horses in each column. The horse with the highest avg is assigned a score of 100, and every other horse will have some percentage of that score.
There are numerous ways to use the BirdDog stats, and we will provide more detail on that in a later video or document. The BirdDog stats are very useful as part of elimination handicapping – removing horses that do not appear to be contenders. If a horse is ranked at the bottom in a factor that has a very low win % you might want to eliminate that horse as a win candidate in your handicapping.
Updated Factor Statistics Table
We have updated the information about each factor in the Factor Statistics table. Here are what the various columns mean.
Win% - The percentage of races that the top ranked horse won within the sample used. If the sample size was 40, and the win% was 50%, then the top ranked horse won 20 of the 40 races used in the sample.
Place% - The percentage of races that the top ranked horse finished 1st or 2nd within the sample used. If the sample size was 40, and the place % was 60%, then the top ranked horse won or placed in 24 of the 40 races used in the sample.
Show%: The percentage of races that the top ranked horse finished 1st, 2nd or 3rd within the sample used. If the sample size was 40, and the place % was 80%, then the top ranked horse won, placed or showed in 32 of the 40 races used in the sample.
Accuracy - This number tells you how accurate the factor was. A perfect score in accuracy would be 100 and that would mean that in every race, that factor had correctly predicted the top 4 finishers in order. The more accurate a factor is (higher accuracy number) the more times you are likely to find the exacta, trifecta and superfecta in the top 4 horses. Factors with high accuracy scores should be used if you are making exotic bets. Factors with High Win%, High Accuracy and positive ROI are extremely important.
Win ROI - This shows you what you would have won or lost if you bet every top ranked horse for a factor to win. Many times you will see that a factor with a very high positive ROI has a low win %. This will tell you that the factor has produced some longshot winners. Over a 40 races, it may have only predicted 15% winners, but each of them may have been high odds horses that resulted in big win payouts. Conversely, low ROI and High Win % would indicate a lot of short priced winners (favorites).
Place ROI - This shows you what you would have won or lost if you bet every top ranked horse for a factor to place.
Show ROI - This shows you what you would have won or lost if you bet every top ranked horse for a factor to show.
TOP4 % - This tells you the percentage of times that a horse ranked within the top 4 in that factor wins the race. If the TOP 4 score for Jockey Current Meet is 82 that would mean that in the group of similar races we are looking at, 82% of the time one of the top 4 horses in Jockey Current Meet will win this race type. This is very useful information for betting Pick 3's, Pick 4's etc.
Advantage - this is the last column (abbreviated as ADV). This shows you the point difference between the top ranked horse and the 2nd ranked horse for that factor. If the ADV is 0.0 that means that there is a tie and the top 2 horses have the same score for that factor. Advantage is very useful to spot dominant horses. Sometimes you will see and advantage of 100, which means that the top ranked horse for that factor may be the only horse in the race with data. Maybe only one horse has started on turf, so he will have advantages of 100 in Turf Speed and Turf Earnings. That may not be a useful advantage in a dirt race. However, pay very close attention to horses that have a big advantage in pace factors.
2ORA – This stands for “2nd or above”, and gives you the percentage of times that a horse ranked 1st or 2nd in that factor wins the race. If the 2ORA score for Jockey Current Meet is 50 that would mean that in the group of similar races we are looking at, 50% of the time one of the top 2 ranked horses for the factor Jockey Current Meet will win this race type.
3ORA – This stands for “3rd or above”, and gives you the percentage of times that a horse ranked 1st, 2nd or 3rd in that factor wins the race. If the 3ORA score for Jockey Current Meet is 60 that would mean that in the group of similar races we are looking at, 60% of the time one of the top 3 ranked horses for the factor Jockey Current Meet will win this race type.
NOLO – This stands for “No Lower Than”. If the NOLO score for a factor is 7, that means that no horse ranked worse than 7th within that factor has won a similar race type in the sample of races. This can be very helpful for eliminating non contenders.
AFOTRH – This stands for “Average finish of top ranked horse”. If the AFOTRH score is 2.5, that means that when you look at all of the sample races the average finish position of the top ranked horse within the factor was 2.5.
AROW – This stands for “Average rank of winner”. This tells you where the winner was ranked within the factor on avg. If the AROW score is 3, that means that on average, the winner of the race was ranked 3rd within that factor. This difference between AROW and AFOTRH is that in AROW we are looking at where the actual winner of the race was ranked within the factor, and in AFOTRH we are looking at where the top ranked horse finished.
BETS – This shows the number of horses that were ranked 1st in the factor you are looking at. It is called BETS, because that is the number of $2 bets that would have been made to compute the Win, Place and Show ROI stats. Sometimes this number may be higher than the number of races used in your sample, and that means that there were ties for horses ranked 1st. When the number is less than the total number of races in your sample that means that there may have been races where no horse was ranked 1st (none of them had data for a factor, maybe something like Best Speed All Weather, meaning that no horse in the race had ever run on that surface.)
Handicapping Overview Widget
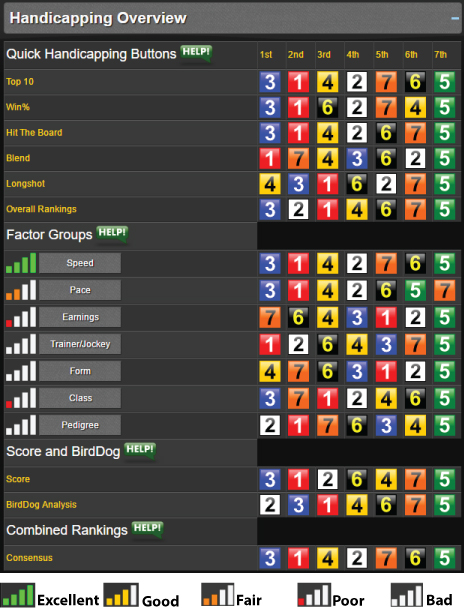
Quick Handicapping Buttons
Top 10 – Uses a weighted blend of the 10 most important factors for the race type
Win% - Uses a weighted blend of the factors with the best win percentages
Hit The Board – Uses factors that predict high percentage of horses that ran 1, 2 or 3
Blend – Uses a mix of factors from each category (Speed, Pace, Earnings, etc.)
Longshot – Uses a mix based on factors with high win ROI numbers.
Overall Rankings – Uses the ideal setting from Overall Rankings. This is based on the setting that predicted the most exactas within the top 4 ranked horses of the sample of similar races.
FACTOR GROUPS
These rankings will give you an idea of how the horses rank within each category using a weighted mix of the factors within that group. Factors that are more highly ranked within the group will be given more weight. You can click on the buttons the represent each factor to see the mix used. To the left of each Factor Group button you will see a "Signal Strength" icon that indicates how strong the factor group is in relation to the other groups. Four Green Bars in the icon is the best and means that the factors within that group are most important for the race type you are handicapping.
SCORE & BIRDDOG
The “Score” rankings are based on ranking the horses using the default factors in the main horse table:
Last Finish Position, Lengths Beaten, Speed Last Race and Class Difference. The score rankings are computed by looking at each horse’s rank within each of those factors and they give you a solid look at horses most qualified to compete in today’s race.
The “BirdDog” rankings use the top 10 factors from the BirdDog table. This table looks at a large number of similar races with the same amount of starters as the race you are handicapping. If you are handicapping a 6f dirt claiming race with 8 starters, the BirdDog stats will be based on a large group of races that were 6f dirt with exactly 8 starters. The BirdDog table lets you see how often a horse wins when ranked at a certain position. The BirdDog ranks takes the 10 best factors for the race type and computes a score from that.
MixBot
The MixBot performs a few tasks for you very quickly. It searches the database for the most recent similar race (Track, distance, surface, class) and then runs MixMaker to find out how that race was optimally handicapped. It will then apply that mix to the race you are currently handicapping. It will then repeat the process for the most recent similar race won by a favorite, medium priced horse and most recent similar race won by a longshot. The results of these mixes will provide you with a very accurate way of looking at today's race.
COMBINED RANKINGS
The combined results of all of the rankings (Quick Handicapping, Factor Groups, Score & BirdDog)
Angler Analysis Widget
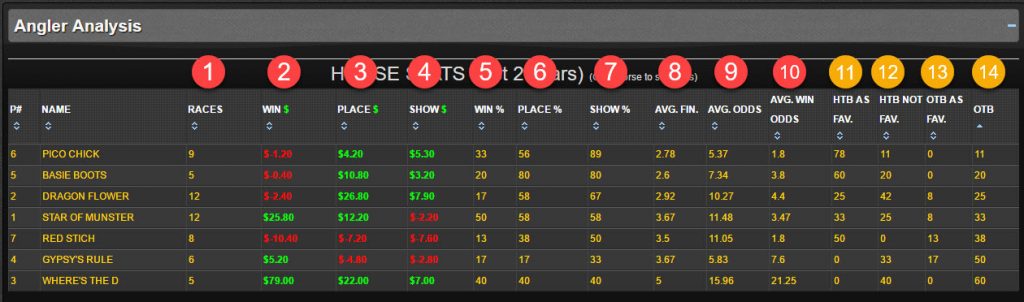
- RACES - The number of races for the horse, trainer, etc. used in the sample.
- WIN $ - Shows you what your ROI would have been for betting this horse to win in each race. Positive ROI numbers are in green.
- Place $ - Shows you what your ROI would have been for betting this horse to place in each race. Positive ROI numbers are in green.
- Show $ - Shows you what your ROI would have been for betting this horse to show in each race. Positive ROI numbers are in green.
- WIN % - What percentage of the time did this horse (or trainer, jockey, etc.) win the race.
- Place % - What percentage of the time did this horse (or trainer, jockey, etc.) run at least second.
- WIN % - What percentage of the time did this horse (or trainer, jockey, etc.) ruin at least 3rd.
- The average finish position.
- The average off odds.
- The average odds for the horse (or trainer, jockey, etc.) when they win
- HTB as Favorite - Does the horse hit the board when its supposed to? If the horse is ranked 1, 2 or 3 in off odds (one of the top 3 betting choices) it should run 1st, 2nd or 3rd. Looking at all of the races in the sample this shows you what % of the time the horse performs well when expected to.
- HTB not Favorite - Does the horse hit the board when its NOT supposed to? If the horse is ranked 4th or worse in off odds (not one of the top 3 betting choices) and it ends up running 1, 2 or 3 then it is running better than expected. Horses, trainers, jockeys, etc that have a high number in this column are potential longshots. They have been underestimated in the past by the betting public and have hit the board when they were not expected to.
- OTB as Favorite - Shows you when the horse does NOT hit the board when its supposed to. If the horse is ranked among the top 3 betting choices and FAILS to run 1st, 2nd or 3rd you will see that percentage in this column. If a horse has a very high percentage in this column it is a "money burner".
- OTB - This shows you how often the horse does not hit the board and was not expected to hit the board (kind of a sad statistic). The horse is not expected to do well and it doesn't. If a horse has a big number here it lets you know that the horse is usually not a favorite and runs poorly.
Class Analysis Widget
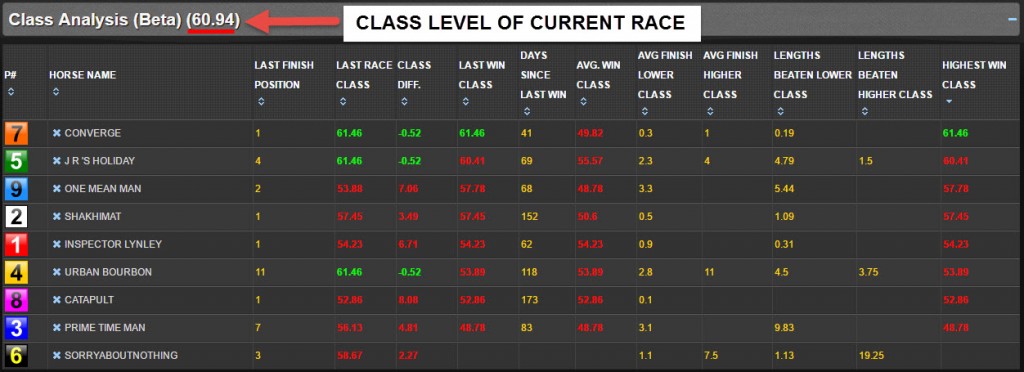
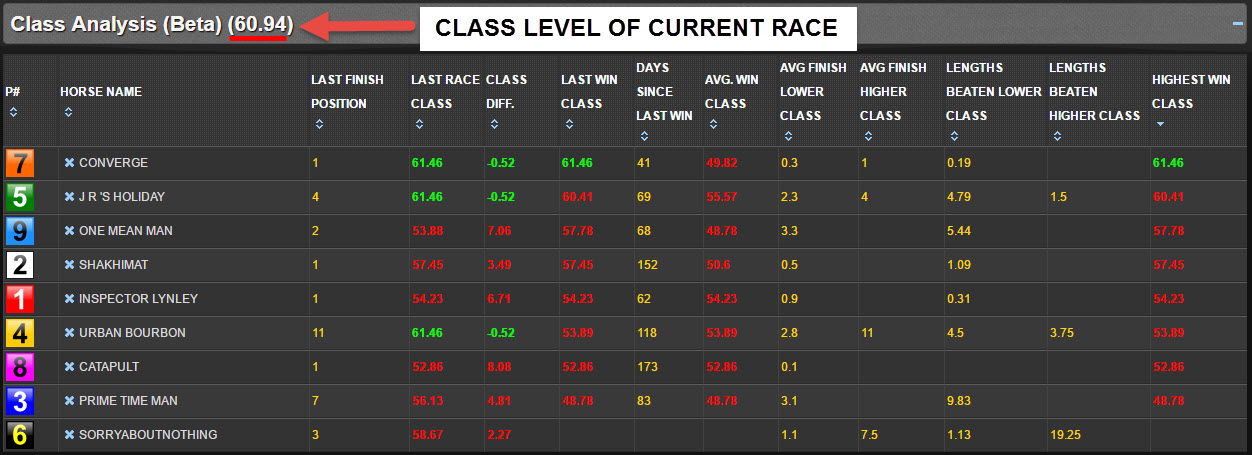
"Keep yourself in the best company and your horses in the worst"
That's the motto that most good horse trainers live by, so its always valuable to know when a horse is truly dropping in "Class".
The new Class Analysis Widget provides a lot of information about how each horse performed from a class standpoint.
Here is the information in the table, and if you are having trouble seeing the image above take a look at the Free Bird Dog race to see how it is displayed.Last Finish Position: where the horse finished in its last race.
Last Race Class: The class level of the horse's last race (Green is higher class, Red is lower Class)Class Diff: The difference between the last race and today's race.
Last Win Class: The class level of the most recent race the horse won.
Days Since Last Win: How many days since the horse won its last race.
Avg Win Class: The average class level of all the races the horse has won.
Avg Finish Lower Class: The average finish position for the horse in races that were "Lower Class" than today's race.
Avg Finish Higher Class: The average finish position for the horse in races that were "Higher Class" than today's race.
Lengths Beaten Lower Class: The average number of lengths the horse was beaten in all of the races it ran that were "Lower Class" than today's race.
Lengths Beaten Higher Class: The average number of lengths the horse was beaten in all of the races it ran that were "Higher Class" than today's race.
Highest Win Class: The "Highest Class" race that the horse has won.