How to use the Handicapping Factor Detail window in Betmix

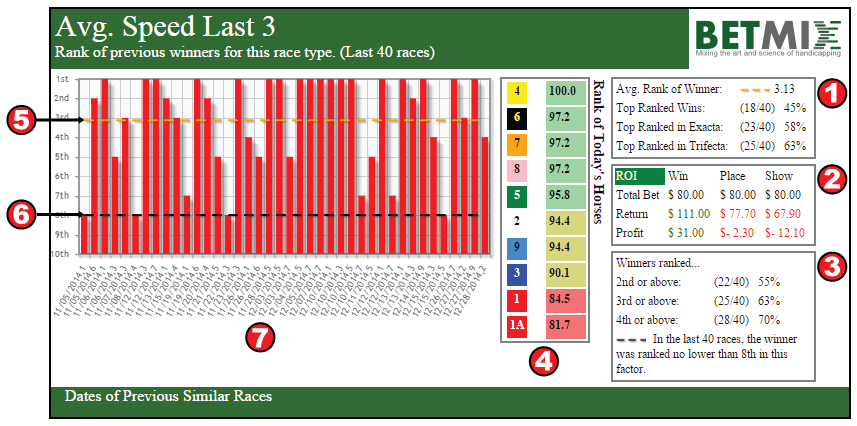
1. This information shows you the Avg. Rank of the winner for this factor. In this example we are looking at the factor AVG SPEED LAST 3. In the box you will notice that the Avg. Rank of the winner is 3.13 which means that in the sample of similar races (last 40 Races) if you only used this factor (Avg. Speed Last 3) the winner was ranked 3.13. The average rank of the winner is also displayed in the graph with a dashed yellow line. If the Avg Rank was "1" that would mean that in every race the horse that had the Best rating for AVG SPEED LAST 3 would have won the race. The lower the average the better!
Top Ranked Wins - This means that in 18 of 40 races (45%) the horse ranked on top for Avg Speed Last 3 won the race.
Top Ranked in Exacta - This means that in 23 of 40 races (58%) the horse ranked on top for Avg Speed Last 3 was part of the exacta (finished 1st or 2nd)
Top Ranked in Trifecta - This means that in 25 of 40 races (63%) the horse ranked on top for Avg Speed Last 3 was part of the trifecta (finished 1st, 2nd or 3rd)
2. The ROI box shows you what you would have won or lost using only this factor to bet each race. In this case since we have 40 races we would have made 40 $2 bets to win and we would have won $111 for a profit of $31. If we would have made 40 $2 place bets we would have bet $80 and won $77.70 for a loss of $2.30. The higher the ROI the better!
3. The Winners Ranked box shows you what percentage of the time the winner was ranked 2nd or above, 3rd or above or 4th or above. In this case, using only this factor (AVG SPEED LAST 3) the winner was ranked in the top 4 70% of the time. You will also see information about the lowest ranking a winner received for this factor in this data sample. In this case no horse ranked worse than 8th for this factor won the race. That information is also displayed in the graph using a dashed black line.
4. This shows you the rankings for the horses in the race you are currently looking at. In this example the top ranked horse for this factor (AVG SPEED LAST 3) is #4. If you scratch a horse you will need to click the pop up again to see the new rankings with the scratched horse removed.
5. In the graph, the dotted yellow line represents the Avg Rank of the winner using this factor across all the races in our data sample (3.13)
6. In the graph, the dotted black line shows you the lowest ranking of a winner using this factor (8th) which would let you know that is is unlikely that a horse would win if it were ranked lower than 8th in this factor.
7. These are all of the races used to compile this information. If you click on one of the lines in the graph it will open up that particular race in MixMaker.

