All posts by Matt O

Sharp Angles – Whitmore Stakes

Whitmore S. (G3) at Oaklawn Park
6F on Dirt (March 19)

Horse Racing Data Analyzed: Last 135 6-furlong dirt stakes at Oaklawn Park
Date Range: January 1, 2012 - Present
Sharp Angle: Ranked 1st in Best Speed Last 3
Factor Stats: 154 contenders, 53 winners (34%, $35.40 flat win bet return, 111 ROI%), 80 place (51%), 95 Show (61%)

Saturday´ s co-featured Whitmore Stakes at Oaklawn Park honors the Eclipse Champion Sprinter who was never off the board in his 16 starts around the Hot Springs oval. The 6-furlong race, formerly named the Hot Springs Stakes, is now rated as a Grade 3 and it drew a salty field of 9.

A scan of the Betmix Angler online handicapping database tells us that the Best Speed Last 3 handicapping factor has pointed to 34% winners of the 6-furlong Oaklawn stakes over the past decade. This factor has also yielded a healthy $35.40 Win Return and over 60% of the contenders have participated in the trifecta.

Find this race in Betmix Birddog and use the Best Speed Last 3 slider to see which horse ranks first in this factor. That’s the Sharp Angles play.

Want to look for your own Angles using Betmix handicapping software?
Click for the Betmix Angler tutorial
Click to subscribe to Betmix


MONDAY MYTHS: HOW MUCH DOES FIELD SIZE IMPACT PAYOFFS?


March 14, 2022 | By Jeremy Plonk/www.horseplayernow.com
Originally published on www.xpressbet.com

Welcome to a continuing handicapping series for our Monday blog space, “Monday Myths.” Each week I’ll use the power of the Betmix database to take common handicapping assumptions and either support or dispel them with data. Betmix data powers the 1/ST BET app and its features like Angler and Birddog give data-minded horseplayers a treasure trove of information in which to query your own curiosities.

Assumption:

Field size is of paramount concern in win betting.

Background:

In an era of reduced field sizes nationally, due to a shrinking foal crop and changes in how horses are campaigned, the number of starters in a race has a dramatic impact on payouts. How much can we quantify that impact?

Data Points:

I dialed up the Betmix database to look at every North American Thoroughbred race over the past year, dating back to mid-March 2021. I separated each race based on the number of starters and documented the average winning price.

5-horse fields have an average winning odds of 2.75-1.

6-horse fields have an average winning odds of 3.43-1.

7-horse fields have an average winning odds of 4.23-1.

8-horse fields have an average winning odds of 5.12-1.

9-horse fields have an average winning odds of 6.16-1.

10-horse fields have an average winning odds of 6.26-1.

11-horse fields have an average winning odds of 7.59-1.

12-horse fields have an average winning odds of 7.48-1.

Overall Findings:

The average winning odds increased by each number of starters in a race from 5 horses through 11 horses and then leveled out in a 12-horse field. The increases were .68, .80 and .89 with 5-6-7-8 horse fields, but jumped 1.04 between 8 and 9 horses and a survey-high 1.33 between 10 and 11 horses.

Bottom line:

There’s absolutely no doubt that the larger the field size, the larger the average payout. Even if you see 5-2 on the toteboard and think “That pays $7 whether there are 7 or 12 horses in a race,” just know that the 5-2 you’re getting in one race isn’t necessarily the same as the other. You could be looking at a favorite in one spot and a third-best chance in a shorter field. As you double the field size, say from 5 to 10 or 6 to 12, you’ll notice that the average winning payoff goes up more than double, which further shows the greater payoff impact of larger fields.

Additional details:

You can go into Betmix and run your own queries for a deeper dive into this theory and any that you can create. For instance, check out the average payoffs at your local track to see how field size impacts the racing there.

Pedigree Handicapping – Derby & Oaks Distance Sires

There have been a lot of questions answered on the 2022 Kentucky Derby and Oaks trails so far. But one mystery will remain until the floral garlands are hoisted on the winners - who can get the distance.

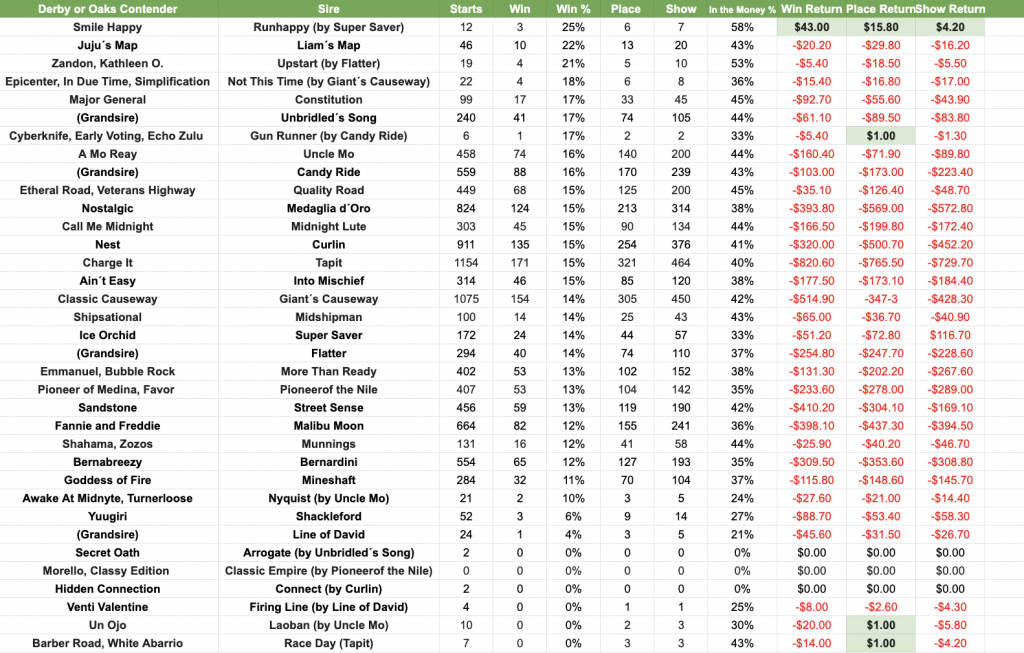
The Betmix Angler online handicapping database has over a decade of stallion information so we took it for a spin to see which sires of this major year´ s Derby & Oaks contenders have the best stats in races going 9-furlongs or further.

Eclipse Champion sprinter Runhappy, sire of the popular contender Smile Happy, is the official leader with a 25% win rate with his long distance starters. However, this is based on just 12 starters and all three of the wins are by his stakes-placed son Happy American. Runhappy is, of course, a son of 2010 Kentucky Derby champ Super Saver.

Not This Time is the sire of a trio of Kentucky Derby prospects and his numbers are encouraging as well, albeit also from a smaller sample. One of these contenders, Epicenter, has already proven himself going long as the victor of the 9-furlong Risen Star Stakes (G2).

The chart below has the data for all sires with a Derby or Oaks contenders in this weekend´ s future pools. Where there was a dearth of data for a younger sire we pulled the numbers on his sire if not already in the sample.

Sharp Angles – Fountain of Youth S.

Fountain of Youth S. (G2) at Gulfstream Park
8.5F on Dirt (March 5)

Horse Racing Data Analyzed: Last 42 8.5-furlong graded dirt stakes at Gulfstream Park
Date Range: January 1, 2012 - Present
Sharp Angle: Ranked 1st in Best Speed Fast Track
Factor Stats: 50 contenders, 22 winners (44%, $55.80 flat win bet return, 155 ROI%), 40 place & show (80%, $5.00 Place Return & $10.90 Show Return)

Saturday´ s Fountain of Youth is the next step on the South Florida road to the Kentucky Derby and it´ s run at the same 8.5 furlong distance as last month´ s Holy Bull Stakes. We uncovered a positive handicapping factor for that one that pointed to Simplification, the $3.70-1 runner-up after a brutal trip. This factor also happens to have been very effective for the Fountain of Youth so let´ s run it back.

The previous query of the Betmix Angler online handicapping database showed that the Best Speed Fast Track factor has yielded strong numbers overall for this race type (see above). This factor has actually added a (short-priced) winner in the past month (Letruska, winner of the Feburary 26 Royal Delta S.).

Some 44% of contenders ranking first in this factor have won, producing a healthy $52.80 Win Return. Among the winners are a trio of recent FOY heroes, including the past two Greatest Honour ($4.00) and Ete Indian ($8.60).

Find this race in Betmix Birddog and use the Best Speed Fast Track slider to see which horse ranks first in this factor. That’s the Sharp Angles play.

Want to look for your own Angles using Betmix handicapping software?
Click for the Betmix Angler tutorial
Click to subscribe to Betmix


February Handicapping Myths

Xpressbet.com & Horseplayer.com's Jeremy Plonk has been using the Betmix online handicapping database to investigate some common handicapping myths. Read & click below for his discoveries during February.

ARE TURF SPRINTS CHAOTIC?

Because of the close quarters, larger fields and often tighter finishes on turf, do these turf sprints actually turn out any less predictable – thus, more chaotic – than other races?

Read more

BEST PLACE TO FIND THE BRIDGEJUMP?

Are bridge-jumper opportunities best sought in smaller-pool, nighttime signals?

Read more

IS RELIABILITY ATTACHED TO PURSE STRINGS?

Are cheaper races are less reliable than larger-purse races?

Read more

TAMPA BAY DOWNS, 'QUIRKY' OR CLICHE?

You can’t watch 2 races at Tampa Bay Downs without hearing about how ‘quirky’ the main track is. From TV commentators to railbirds, it’s a common refrain. But is it true? 

Read more

Sharp Angles – Rebel Stakes & Honeybee Stakes

Rebel S. (G2) & Honeybee S. (G3) at Oaklawn Park
8.5F on Dirt (February 26)

Horse Racing Data Analyzed: Last 74 8.5-furlong graded stakes at Oaklawn Park
Date Range: January 1, 2012 - Present
Sharp Angle: Ranked 1st in Avg. Last 3 Turn Time
Factor Stats: 82 contenders, 21 winners (25%, $118.40 flat win bet return, 172 ROI%), 30 Place (36%), 48 Show (58%, $18.80 Show Return)

The train towards the Kentucky Derby weekend rolls on and gains steam with every passing week. Next stop: Oaklawn Park, host of Saturday's $1 million Rebel Stakes (G2) for colts with Derby aspirations and the Honeybee S. (G3) for fillies aiming for the lilies.

The Betmix Angler online handicapping database tells us that Avg. Last 3 Turn Time has produced 25% winners of the 8.5 furlong graded stakes in Hot Springs since 2012. It's true that the wild $118.40 Win Return is due in large part to Super Steed, the 62-1 winner of the 2019 Southwest Stakes. However, this handicapping factor has pointed to two recent Rebel winners - Magnum Moon ($8.00) in 2018 and Concert Tour ($5.40) last year.

Find this race in Betmix Birddog and use the Avg. Last 3 Turn Time slider to see which horse ranks first in this factor. That’s the Sharp Angles play.

Want to look for your own Angles using Betmix handicapping software?
Click for the Betmix Angler tutorial
Click to subscribe to Betmix

MONDAY MYTHS: ARE TURF SPRINTS CHAOTIC?


February 21, 2022 | By Jeremy Plonk/www.horseplayernow.com
Originally published on www.xpressbet.com

Welcome to a continuing handicapping series for our Monday blog space, “Monday Myths.” Each week I’ll use the power of the Betmix database to take common handicapping assumptions and either support or dispel them with data. Betmix data powers the 1/ST BET app and its features like Angler and Birddog give data-minded horseplayers a treasure trove of information in which to query your own curiosities.

Assumption:

Turf sprints are chaotic.

Background:

The proliferation of turf sprint races to the daily schedule has exploded in the last several years, often filling cards with larger field sizes and more difficult handicapping tasks. Because of the close quarters, larger fields and often tighter finishes on turf, do these turf sprints actually turn out any less predictable – thus, more chaotic – than other races? Let’s go to the numbers.

Data Points:

I dialed up the Betmix database to look at every turf sprint in America for the 2021 racing season. I compared those results in terms of average winning odds and favorites’ win percentage to non-turf sprints. I also normalized for field size in a separate data dive. For turf sprints, I considered turf races at 6-1/2 furlongs or less; for turf routes, those at 1 mile or longer.

Overall Findings:

Favorites won 37.9% in turf sprints.
Favorites won 36.9% in turf routes.
Favorites won 37.2% in dirt races.

//

The average turf sprint winner was 5.05-1.
The average turf route winner was 5.04-1.
The average dirt winner was 5.30-1.

//

In fields of 10, favorites won 32.2% in turf sprints.
In fields of 10, favorites won 35.2% in turf routes.
In fields of 10, favorites won 31.6% in dirt races.

//

In fields of 10, the average turf sprint winner was 7.01-1.
In fields of 10, the average turf route winner was 5.84-1.
In fields of 10, the average dirt winner was 6.55-1.

//

Overall Findings:

Overall, turf sprints had a higher win % than turf routes and dirt races by a 0.7 to 1% difference. The average winner paid nearly identical in turf sprints to turf routes, which was 0.25-0.26 lower than in dirt races last year. As the fields expanded to our ‘full’ sample of 10, turf sprints became less predictable than turf routes by 3% in terms of winning favorites and 1.17 greater in average winning odds. They drew closer to even with dirt sprints in trustworthy favorites, but paid .46 more on average than dirt runners in the 10-horse fields.

Bottom line:

Turf sprints, as a whole, aren’t more chaotic than turf routes or dirt races, rather they stack up as more reliable and predictable in their results. But in full-field situations, the turf sprints become much more in tune with their chaotic reputation. The bigger the field, the truer this myth looks.

Additional details:

You can go into Betmix and run your own queries for a deeper dive into this theory and any that you can create. For instance, test these numbers specifically to the track you play to see if they shake out the same or differently.

Sharp Angles – Risen Star S.

Risen Star S. (G2) at Fair Grounds
9F on Dirt (February 13)

Horse Racing Data Analyzed: Last 19 9-furlong graded dirt stakes at Fair Grounds
Date Range: January 1, 2012 - Present
Sharp Angle: Ranked 1st in Avg. Last 3 Late Pace
Factor Stats: 20 contenders, 5 winners (25%, $48.60 Win Return, 221 ROI%), 8 Place (40% $17.60 Place Return) 12 show (60% $6.40 Show Return)

The first of the ¨"Championship Series" Kentucky Derby points races is Saturday with the Risen Star Stakes at Fair Grounds. Now run at a mile and one eighth after being run a sixteenth of a mile shorter for most of it´ s history, the Risen Star drew a 10-horse field of sophomores from around the country.

The Betmix Angler online handicapping database tells us that Avg. Last 3 Late Pace has been a predictive handicapping factor for the 9-furlong graded dirt stakes at Fair Grounds.

This factor was particularly effective in 2020 when the Risen Star was carded at 9 furlongs for the first time and run in two divisions. Enforceable, the 4.60-1 runner up in the 1st division was top-ranked in Avg. Last 3 Late Pace as was Modernist, the $27.60 winner of the 2nd division.

Find this race in Betmix Birddog and use the Avg. Last 3 Late Pace slider to see which horse ranks first in this factor. That’s the Sharp Angles play.

Want to look for your own Angles using Betmix handicapping software?
Click for the Betmix Angler tutorial
Click to subscribe to Betmix

MONDAY MYTHS: BEST PLACE TO FIND THE BRIDGEJUMP?


February 13, 2022 | By Jeremy Plonk/www.horseplayernow.com
Originally published on www.xpressbet.com

Welcome to a continuing handicapping series for our Monday blog space, “Monday Myths.” Each week I’ll use the power of the Betmix database to take common handicapping assumptions and either support or dispel them with data. Betmix data powers the 1/ST BET app and its features like Angler and Birddog give data-minded horseplayers a treasure trove of information in which to query your own curiosities.

Assumption:

Bridge-jumpers are best sought in smaller-pool, nighttime signals.

Background:

Bridge-jumpers in horse racing terms are those who bet large sums to show on what appears to be a sure thing. When said sure thing doesn’t deliver a top-3 finish, said handicappers are assumed to be looking for the next bridge from which to jump. Or so the legend goes. But these bridge-jumping handicappers exist and you’ll see their appearances heavily tilt show pools each week. It seems as though it happens most often on smaller, night-time signals. One of the reasons being that the state of West Virginia, home to Mountaineer and Charles Town, mandates a minimum $2.20 payout vs. $2.10 in nearly all other jurisdictions. The bridge-jumper stands to make an additional 5% return in West Virginia, doubling his or her winnings from other states. We do see high-profile bridge-jumping situations. Recall Arrogate finishing 4th of 5 at 1-20 odds in the 2017 San Diego at Del Mar, causing $22, $67 and $38 returns to show. But is it true that the smaller venues are where to find most of this action?

Data Points:

I dialed up the Betmix database to look at every $20-plus show payoff since the start of 2017, a little more than five years. The database found just over 1,600 such returns, often multiple in the same race as all 3 runners across the board saw large payoffs. I filtered by tracks to see the top-10 most prevalent, and by class.

Overall Findings:

-Charles Town had 133 show returns of $20-plus.

-Gulfstream had 133 show returns of $20-plus.

-Parx had 94 show returns of $20-plus.

-Mountaineer had 91 show returns of $20-plus.

-Delta Downs had 83 show returns of $20-plus.

-Woodbine had 71 show returns of $20-plus.

-NYRA (Aqu-Bel-Sar) had 70 show returns of $20-plus.

-Remington Park had 65 show returns of $20-plus.

-Laurel Park had 56 show returns of $20-plus.

-Mahoning Valley had 49 show returns of $20-plus.

//

Maiden claimers had 392 show returns of $20-plus.

Maiden special weight had 236 show returns of $20-plus.

Claiming races had 676 show returns of $20-plus.

Allowance races had 215 show returns of $20-plus.

Stakes races had 103 show returns of $20-plus.

Overall Findings:

Charles Town, in West Virginia, tied for the most bridge-jumper show returns along with Gulfstream Park, which runs the most live dates of any singular, daytime signal in America by far annually. Four of the top-8 most likely venues for a $20-plus show return, indeed, were smaller, nighttime signals (CT, Mnr, DeD, RP). In terms of race-class and impact on bridge-jumper results, more than 1000 of the 1600+ such returns came in either claiming or maiden claiming races. The higher the class, the fewer such examples.

Bottom line: While it’s not wildly obvious and confirmed, the numbers do indicate there’s a reasonable amount of truth to the assumption that the smaller night-time signals are the bridge-jumpers’ havens. And notably, Mountaineer has cut its racing dates in recent years, otherwise may rank higher than its current No. 4 spot overall.

Additional details:

You can go into Betmix and run your own queries for a deeper dive into this theory and any that you can create. For instance, research the impact of field size on bridge-jumper returns or perhaps distance and surfaces to try and unearth where the next might be most likely to happen.

Sharp Angles – Sam F. Davis S.

Sam F. Davis S. (G3) at Tampa Bay Downs
8.5F on Dirt (February 12)

Horse Racing Data Analyzed: Last 20 8.5-furlong graded dirt stakes at Tampa Bay Downs
Date Range: January 1, 2012 - Present
Sharp Angle: Ranked 1st in Avg. of Last 3 E2 Pace
Factor Stats: 20 contenders, 8 winners (40%, $30.40 flat win bet return, 176 ROI%), 11 show (55%)

The Sam F. Davis Stakes has drawn another overflow field of Kentucky Derby hopefuls, presenting a big challenge for horseplayers.

We queried the Betmix Angler online handicapping database about the 8.5 furlong graded dirt stakes at Tampa and we uncovered a lucrative handicapping factor that´´ s been especially relevant to the Davis.

Avg. of Last 3 E2 Pace has pointed to 40% winners of this race type overall but, more specifically to the last FOUR Sam F. Davis winners - Flameaway ($22.80) in 2018, Well Defined ($16.00) in 2019, 2020 winner Sole Volante ($13.60) and last year's hero Candy Many Rocket ($8.20).

Find this race in Betmix Birddog and use the Avg. of Last 3 E2 Pace slider to see which horse ranks first in this factor. That’s the Sharp Angles play.

Want to look for your own Angles using Betmix handicapping software?
Click for the Betmix Angler tutorial
Click to subscribe to Betmix