The importance of speed can sometimes get lost in all of the other data that you consider when handicapping a race.
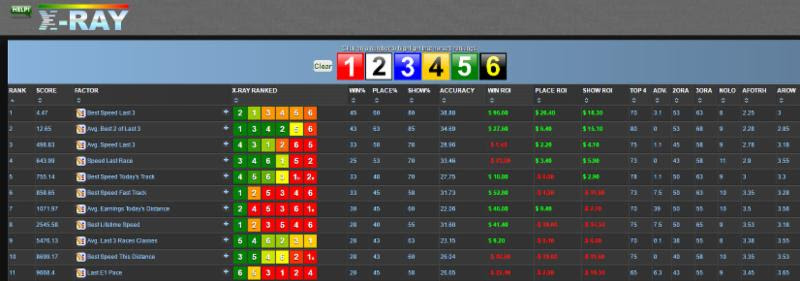
We have added a new button in the Factor Statistics section of BirdDog that allows you to see how important certain Speed factors are for the race you are handicapping.
Most of the information that you see in the new Speed table is also available in Factor Stats, but the Speed Table brings in a larger sample of races and also shows you some stats about Speed and Pace combinations.
The goal here is to help you keep things simple. If you are handicapping a race and you know that 85% of the time a horse ranked in the top 4 for speed last race wins, you should probably make sure your win choice is among those 4 horses. This really helps narrow down large fields to a manageable number of contenders.
When you click on the SPEED button you will see a table like this pop up:

1 - This shows you how many race are in the sample (same track, distance, surface and class)
2 - R1 means "ranked 1st". This column shows you how often a horse ranked 1st in the factor won the race. In this example horses ranked 1st in Best Speed Last 3 won 28 of the 73 races in the sample or 38.36% of the time.
3 - R1-2 means "ranked 1st or 2nd". This column shows you how often a horse ranked 1st or 2nd in the factor won the race. In this example horses ranked 1st or 2nd in Best Speed Last 3 won 49 of the 73 races in the sample or 67.12% of the time.
4 - R1-3 means "ranked 1st, 2nd or 3rd". This column shows you how often a horse ranked 1st through 3rd in the factor won the race. In this example horses ranked 1st through 3rd in Best Speed Last 3 won 58 of the 73 races in the sample or 79.45% of the time.
5 - R1-4 means "ranked 1st, 2nd, 3rd or 4th". This column shows you how often a horse ranked 1st through 4th in the factor won the race. In this example horses ranked 1st through 4th in Best Speed Last 3 won 67 of the 73 races in the sample or 91.78% of the time. Of the 73 similar races only 6 of them were won by horses not ranked in the top 4 for Best Speed Last 3. That is a very useful stat and is the kind of thing that you should pay very close attention to when handicapping.
6 - This column shows you how the horses rank within each of the speed factors.The colors give you a better idea of how closely they are ranked. In the Best Speed Last 3 row the #3 horse is the only Green horse, so he is a "standout" in that factor. If you look at the second row (Avg Speed Last 3) the top 4 horses are all green which means that they are very closely ranked. This is important to look at. If you are looking at limiting your selections to the top 4 and you see that 6 of 8 horses in the race are all green then that makes the factor a little less reliable since most of the horses have similar abilities.
7 - This section shows you how well horses who are ranked 1st in a speed category and 1st in a pace category run. In this example there is only a match on ranked 1st in Best Speed Last 3 and ranked 1st in Avg Late Pace. Horse #1 is ranked 1st in both of those, and when that has happened in the past those types of horses have won 42.31% of the time. Keep in mind that the sample sizes for matches are going to be smaller since there are not always going to be matches (ranked first in a speed and pace category).The SPEED button should be incorporated into your handicapping and should be one of the first things you look at. Keep an eye on the Total Races Found number, if it is very low then the info is less reliable. Use this as a screen to check the top ranked horse from your mix to make sure you are not betting on a hopelessly slow horse in a race where speed really matters. You can also use this tool to find overlooked longshots. A great example of this was at Delaware Park yesterday in race #4. Horse #11, Thurgood, was ranked 1st in Best Lifetime Speed, Best Speed Turf, Best Speed at the track and Best Speed at the distance. He was ranked last in Speed Last Race. He ended up winning and paid a very generous $101.


