All posts by Matt O

MONDAY MYTHS: IS RELIABILITY ATTACHED TO PURSE STRINGS?

February 7, 2022 | By Jeremy Plonk/www.horseplayernow.com
Originally published on www.xpressbet.com

Welcome to a continuing handicapping series for our Monday blog space, “Monday Myths.” Each week I’ll use the power of the Betmix database to take common handicapping assumptions and either support or dispel them with data. Betmix data powers the 1/ST BET app and its features like Angler and Birddog give data-minded horseplayers a treasure trove of information in which to query your own curiosities.

Assumption:

Cheaper races are less reliable than larger-purse races.

Background:

You’ll often hear horseplayers turn their nose up at lower-end racing and say it’s simply too unpredictable and not trustworthy. But how do the lower-purse races stack up with their richer brethren in terms of reliability? Is there truth to the assumption that the higher the purse, the better quality and more trustworthy the likely results?

Data Points:

I dialed up the Betmix database to look at all races in 2021 nationally based on purse levels. I wanted to see the average win odds and the percentage of winning favorites to see how chaotic or trustworthy races were based on purse alone.

Races with $10,000 or less purse had an average winner of 4.68-1 odds and 39.5% winning favorites.

Races with $15,000-$25,000 purse had an average winner of 4.91 odds and 37.7% winning favorites.

Races with $30,000-$50,000 purse had an average winner of 4.81 odds and 37.0% winning favorites.

Races with $55,000-$95,000 purse had an average winner of 4.77 odds and 37.7% winning favorites.

Races with $100,000-$200,000 purse had an average winner of 4.98 odds and 37.2% winning favorites.

Overall Findings:

In 2021, the $10,000 or less purses produced the highest percentage of winning favorites and the lowest average winning odds. The results didn’t waiver a great deal across the remaining purse levels, varying only 0.7% in winning favorites and 0.21 in terms of average winning odds.

Bottom line:

The trustworthiness of a horse does not appear to be tied in any way to the purse level of the race. After all, the competition is the competition, and while a more lucrative racehorse will race in more lucrative races, he/she doesn’t hold any more distinct advantage over that similar class. If you like a horse, regardless of purse, bet them with the same confidence – this one is a myth based on the numbers.

You can go into Betmix and run your own queries for a deeper dive into this theory and any that you can create. For instance, search your favorite track by purse levels and see if there’s any trust gained or lost across the board.

Sharp Angles – Holy Bull Stakes

Holy Bull S. (G3) at Gulfstream Park
8.5F on Dirt (February 5)

Horse Racing Data Analyzed: Last 40 8.5-furlong graded dirt stakes at Gulfstream Park
Date Range: January 1, 2012 - Present
Sharp Angle: Ranked 1st in Best Speed Fast Track
Factor Stats: 47 contenders, 21 winners (44%, $59.60 flat win bet return, 163 ROI%), 38 place & show (80%, $3.50 Place Return & $11.40 Show Return)

There is no shortage of hope for owners of 3-year-old colts in early February. Consequently, there is a shortage of space in the starting gate for the Holy Bull Stakes on Saturday at Gulfstream Park where 9 evenly-matched runners will square off.

A query of the Betmix Angler online handicapping databases shows that the Best Speed Fast Track factor has been key in the 8.5 furlong graded dirts stakes at Gulfstream and in the Holy Bull specifically.

Some 44% of contenders ranking first in this factor have won, producing a healthy $52.80 Win Return. Among the winners are six Holy Bull heroes in the last decade - Greatest Honour ($7.60) winner of one of the Holy Bull divisions last year preceded by Audible ($8.40), Moyhamen ($2.60), Upstart ($6.20), Cairo Prince ($6.20) and Itsmyluckyday ($11.40).

What's more is the fact that 80% of the contenders have hit the board, so it surely looks wise strongly consider this factor into your Holy Bull wagering strategy.

Find this race in Betmix Birddog and use the Best Speed Fast Track slider to see which horse ranks first in this factor. That’s the Sharp Angles play.

Want to look for your own Angles using Betmix handicapping software?
Click for the Betmix Angler tutorial
Click to subscribe to Betmix


MONDAY MYTHS: TAMPA BAY DOWNS, ‘QUIRKY’ OR CLICHE?

February 1, 2022 | By Jeremy Plonk/www.horseplayernow.com
Originally published on www.xpressbet.com

Welcome to a continuing handicapping series for our Monday blog space, “Monday Myths.” Each week I’ll use the power of the Betmix database to take common handicapping assumptions and either support or dispel them with data. Betmix data powers the 1/ST BET app and its features like Angler and Birddog give data-minded horseplayers a treasure trove of information in which to query your own curiosities. 

Assumption: 

Tampa Bay Downs is a ‘quirky’ main track, and horses often struggle to successfully handle the footing. 

Background: 

Ranking up there almost as high as racetracker cliches like “You can’t beat the races,” “Bet the gray on a rainy day” and “The rail is dead today,” you can’t watch 2 races at Tampa Bay Downs without hearing about how ‘quirky’ the main track is. From TV commentators to railbirds, it’s a common refrain. But is it true? 

Data Points: 

I dialed up the Betmix database for all Tampa Bay Downs main track races over the past 3 years, going back to January 31, 2019. That sample of more than 1,100 races looked at horses who came out of races at Tampa Bay Downs and those who exited races elsewhere. I studied races at all class levels and based on common odds. 

Overall Findings: 

All horses last raced at Tampa Bay Downs won 12.9% with a $0.77 ROI. 
All horses last raced away from Tampa Bay Downs won 13.2% with a $0.70 ROI. 

// 

All maiden horses last raced at Tampa Bay Downs won 12.0% with a $0.76 ROI. 
All maiden horses last raced away from Tampa Bay Downs won 12.9% with a $0.68 ROI. 

// 

All claiming horses last raced at Tampa Bay Downs won 13.4% with a $0.79 ROI. 
All claiming horses last raced away from Tampa Bay Downs won 12.3% with a $0.64 ROI. 

// 

All allowance horses last raced at Tampa Bay Downs won 14.1% with a $0.67 ROI. 
All allowance horses last raced away from Tampa Bay Downs won 16.4% with a $0.95 ROI. 

// 

All stakes horses last raced at Tampa Bay Downs won 9.5% with a $0.64 ROI. 
All stakes horses last raced away from Tampa Bay Downs won 15.2% with a $0.88 ROI. 

// 

All horses 5-1 or less last raced at Tampa Bay Downs won 24.6% with a $0.80 ROI. 
All horses 5-1 or less last raced away from Tampa Bay Downs won 25.4% with a $0.79 ROI. 

// 

All favorite horses last raced at Tampa Bay Downs won 36.4% with a $0.83 ROI. 
All favorite horses last raced away from Tampa Bay Downs won 39.9% with a $0.90 ROI. 

Overall Findings: 

Horses last raced away from Tampa Bay Downs won at a slightly higher percentage overall in all races than those exiting local races. They were a bit more successful in maiden races, more than 2.3% more successful in the allowance ranks and a whopping 5.7% at the stakes level. The only class where the locals fared best were in the claiming ranks with a 1.2% advantage. Among those horses expected to run well by the public, the out of towners won at 0.8% better among runners 5-1 or less and by a significant 3.5% higher rate with favorites. 

Bottom line: 

There’s nothing in the results that makes you consider Tampa a ‘quirky’ surface in which to avoid those from out of town. Outside of the claiming races, where the class probably is less a deciding factor than at other levels, the locals have trailed their ship-in foes. This one is a total myth, a falsity that Tampa is ‘quirky’ and unpredictable. 

You can go into Betmix and run your own queries for a deeper dive into this theory and any that you can create. For instance, which trainers have done best bringing horses into Tampa? 

Sharp Angles – Pegasus World Cup Turf

Pegasus World Cup Turf (G1)
9F on Turf (January 29)

Horse Racing Data Analyzed: Last 23 8-furlong turf graded stakes at Gulfstream Park
Date Range: January 1, 2012 - Present
Sharp Angle: Ranked 1st Avg. of Last 3 E2 Pace
Factor Stats: 24 contenders, 7 winners (29%) $87.40 Win Return, (282 ROI%), 8 Place (33%) $4.50 Place Return, 12 Show (50%)

The Pegasus World Cup card at Gulfstream Park. has very quickly become the highlight of winter racing for many horseplayers in North America. The card took another leap in 2019 when the Pegasus Turf was added and this year´ s fourth edition of the race (formerly named Gulfstream Park Turf H.) has drawn a predictably deep and contentious field.

Deep and contentious fields are exactly what the Betmix Angler online handicapping database was built for. A scan of the database has revealed that the Avg. of Last 3 Late Pace has been predictive and profitable for big data handicappers. Angler tells us that the hottest trainers have had and edge in these 6-furlong non-graded stakes at Oaklawn.

Nearly 30% of the contenders ranking first in this factor have had their pictures taken while generating a whopping $87.40 Win Return.

Find this race in Betmix Birddog and use the Avg. of Last 3 Late Pace slider to see which horse ranks first in this factor. That’s the Sharp Angles play.

Want to look for your own Angles using Betmix handicapping software?
Click for the Betmix Angler tutorial
Click to subscribe to Betmix

Sharp Angles – American Beauty Stakes

American Beauty S. at Oaklawn Park
8F on Dirt (January 22)

Horse Racing Data Analyzed: Last 121 6-furlong non-graded stakes at Oaklawn
Date Range: January 1, 2012 - Present
Sharp Angle: Ranked 1st Avg. of Last 3 E2 Pace
Factor Stats: 133 contenders, 31 winners (23%) $48.00 Win Return, (118 ROI%), 53 Place (39%), 66 Show (49%)

Saturday´ s Card at Oaklawn Park is highlighted by the $150,000 American Beauty Stakes for distaff sprinters and it´ s drawn a deep and competitive field. These kind of fields are typical in Hot Springs, Arkansas these days.

Deep and competitive fields can be a boon to horseplayers who use the Betmix Angler online handicapping database. Indeed, Angler tells us that the hottest trainers have had and edge in these 6-furlong non-graded stakes at Oaklawn.

The horse ranking first in the Trainer This Year handicapping factor has scored in 23% of these contests while generating a juicy $48 Win Return

Find this race in Betmix Birddog and use the Trainer The Year slider to see which horse ranks first in this factor. That’s the Sharp Angles play.

Want to look for your own Angles using Betmix handicapping software?
Click for the Betmix Angler tutorial
Click to subscribe to Betmix

MONDAY MYTHS: PROVEN COMMODITIES OR CLASS RISERS IN 3YO STAKES?


January 17, 2022 | By Jeremy Plonk/www.horseplayernow.com
Originally published on www.xpressbet.com

Welcome to a continuing handicapping series for our Monday blog space, “Monday Myths.” Each week I’ll use the power of the Betmix database to take common handicapping assumptions and either support or dispel them with data. Betmix data powers the 1/ST BET app and its features like Angler and Birddog give data-minded horseplayers a treasure trove of information in which to query your own curiosities.

Assumption:

January and February are when the rising star 3-year-olds make their stakes presence known.

Background:

As the road to the Triple Crown picks up passengers early in the year, horseplayers are often looking for the next big thing to take on the known stakes players. But should you, as bettors, be looking more for the proven commodities at this point or the rising stars?

Data Points:

I dialed up the Betmix database to look at all 3-year-old stakes in January and February over the past 3-plus years. I sorted each starter by the class of race each horse exited last time out and how they fared in stakes races.

Overall Findings:

January & February 3-year-old stakes horses exiting maiden claiming races won 4.8% with a $1.16 ROI for every $1 bet.

January & February 3-year-old stakes horses exiting maiden special weight races won 15.8% with a $0.82 ROI for every $1 bet.

January & February 3-year-old stakes horses exiting claiming races won 5.9% with a $0.73 ROI for every $1 bet.

January & February 3-year-old stakes horses exiting allowance races won 10.6% with a $0.58 ROI for every $1 bet.

January & February 3-year-old stakes horses exiting listed stakes races won 13.2% with a $0.64 ROI for every $1 bet.

January & February 3-year-old stakes horses exiting graded stakes races won 17.9% with a $1.01 ROI for every $1 bet.

Overall Findings:

Graded stakes alumni had the best win percentage by more than 2 points and also the second-best ROI for every $1 bet (note the maiden claiming ROI was principally one $153 upsetter skewing the results). The maiden special weight runners were second-most likely winners , more than 2.5 points higher than listed stakes alumni. But the ROI for the maiden special weight risers was far short of the graded stakes types.

Bottom line:

Known commodities from the graded stakes ranks are still the best way to go this time of year in the 3-year-old stakes ranks. While the maiden special weight class risers win a solid share, their ROI indicates they’re over-valued by the betting public at this point on the calendar.

You can go into Betmix and run your own queries for a deeper dive into this theory and any that you can create. For instance, which trainers do best in the 3-year-old stakes via various class levels of development?

Pedigree Handicapping – 2021 Turf Sires

It was another fantastic season of grass racing across North America in 2021.

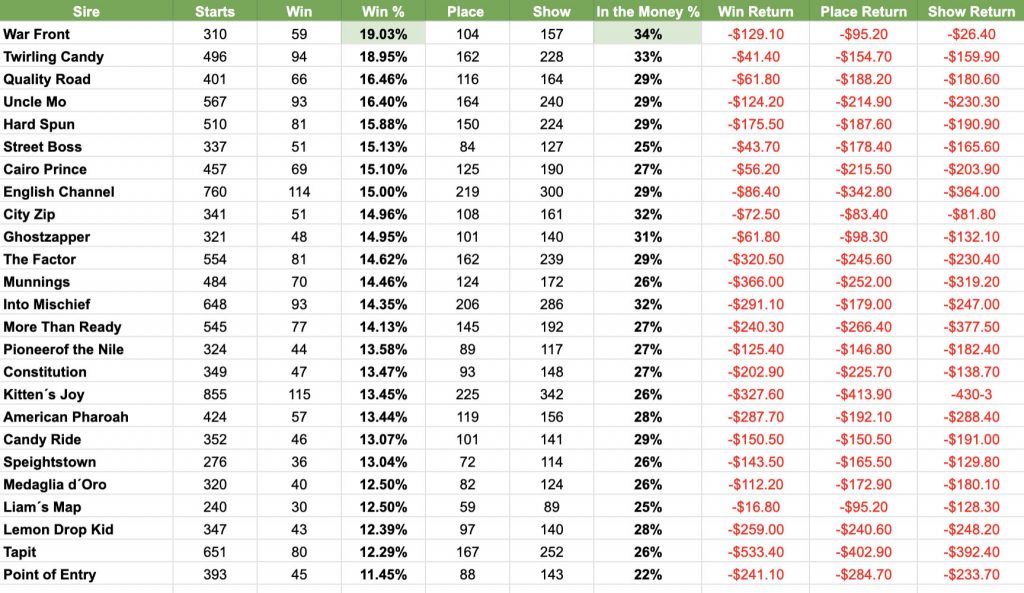
Below are the results of our annual Betmix Angler online handicapping database survey of the year´´´ s leading grass sires.

The Claiborne Farm stallion War Front was a dirt sprinter/miler in his racing days but, like many stallions from the Danzig sire-line, his runners are incredibly adept when competing on the green. He lead all sires last year with a 19% Win % with Twirling Candy and Quality Road right behind him.

In terms of In the Money %, War Front is also tops with a 34% rate followed again by Twirling Candy at 33%. The great Into Mischief is getting more and more turf runners as evidenced by his 32% In the Money clip. City Zip (32%) and his half-brother Ghostzapper (31%) are the other stallions whose grass runners hit the board at least 30% of the time in 2021.

MONDAY MYTHS: DO JOCKEY CHANGES MAKE A DIFFERENCE?


January 10, 2022 | By Jeremy Plonk/www.horseplayernow.com
Originally published on www.xpressbet.com

Welcome to a continuing handicapping series for our Monday blog space, “Monday Myths.” Each week I’ll use the power of the Betmix database to take common handicapping assumptions and either support or dispel them with data. Betmix data powers the 1/ST BET app and its features like Angler and Birddog give data-minded horseplayers a treasure trove of information in which to query your own curiosities.

Assumption:

Jockey changes can make a significant difference.

Background:

Jockeys are like Quarterbacks in football – they probably take too much blame for a loss and get too much credit for a win. But you can’t watch a race around a group of people without some comment about the riders pre-race and post-race. So how much impact do they have when a rider change is made from race to race?

Data Points:

I dialed up the Betmix database for all races in 2021 and studied the horses who made a jockey change from their previous race. I measured the jockey change as positive or negative based on bob riders’ win percentages. I looked at various class levels to see if jockey changes meant any more or less with the quality of horses.

Overall Findings:

Horses moving from a higher percentage jockey to a lower percentage jockey won 10.3% with $0.74 ROI.
Horses moving from a lower percentage jockey to a higher percentage jockey won 13.7% with $0.77 ROI.

//

Maiden claiming horses moving from a higher percentage jockey to a lower percentage jockey won 10.8% with $0.71 ROI.
Maiden claiming horses moving from a lower percentage jockey to a higher percentage jockey won 14.2% with $0.77 ROI.

//

Maiden special weight horses moving from a higher percentage jockey to a lower percentage jockey won 11.2% with $0.78 ROI.
Maiden special weight horses moving from a lower percentage jockey to a higher percentage jockey won 13.1% with $0.69 ROI.

//

Claiming horses moving from a higher percentage jockey to a lower percentage jockey won 11.1% with $0.75 ROI.
Claiming moving from a lower percentage jockey to a higher percentage jockey won 14.1% with $0.80 ROI.

//

Allowance moving from a higher percentage jockey to a lower percentage jockey won 10.9% with $0.67 ROI.
Allowance moving from a lower percentage jockey to a higher percentage jockey won 13.9% with $0.72 ROI.

//

Stakes horses moving from a higher percentage jockey to a lower percentage jockey won 9.1% with $0.66 ROI.
Stakes horses moving from a lower percentage jockey to a higher percentage jockey won 12.9% with $0.77 ROI.

Overall Findings:

At each class level and overall, horses going from a lower to higher percentage jockey increased their chances of victory by about 3% overall in strike rate. The findings and gap between the positive and negative jockey changes remained very consistent across the various class levels. And even though the presence of a better jockey would by assumption keep the price down on the return bid, the overall ROI for this positive jockey move still rates better than a step down in jockey in terms of value.

Bottom line:

Horses making a positive rider change aren’t automatic bets, but they’re certainly better bets than those that are going from a higher percentage jockey to a lower one. Overall, it’s safe to say a jockey change can make a statistical difference. You can go into Betmix and run your own queries for a deeper dive into this theory and any that you can create. For instance, check which trainers are more potent when changing jockeys or which tracks these kinds of moves are more or less successful.

Pedigree Handicapping – 2021 Juvenile Sires

The 2021 juvenile racing season officially came to a close when the ball dropped on New Year´ s Eve. With the data finalized, we took the Betmix Angler online handicapping database for a spin to see if we could gain any insights for the 2022 season.

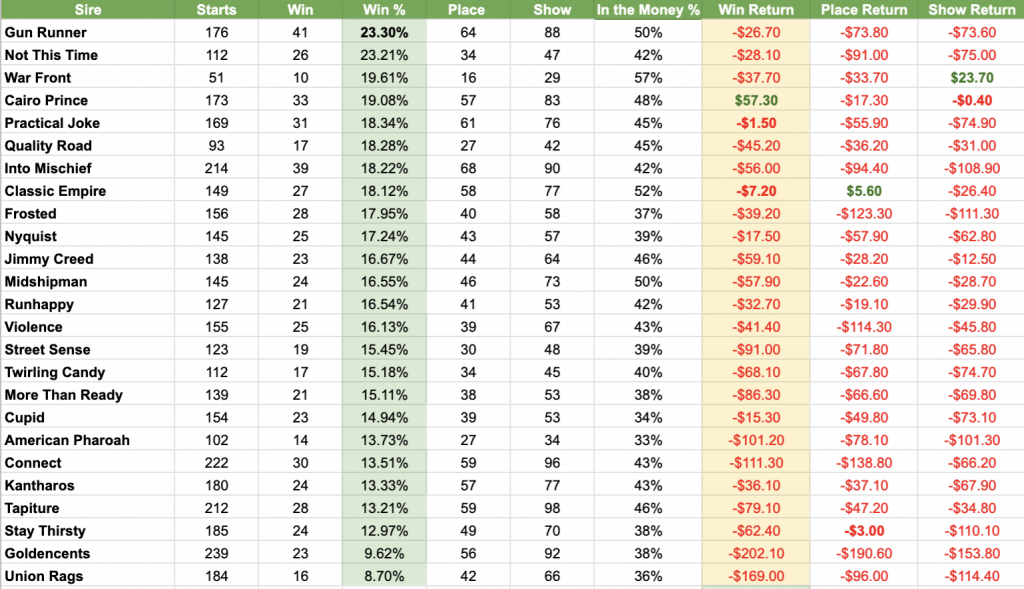
Gun Runner burst on the scene as a potentially important sire for breeders and Angler tells us he ranks first among all of the 2021 Top 25 Juvenile Sires (by progeny earnings) in terms of Win %.

As the chart below indicates, a little over 23% of the starts by his first crop runners resulted in a winner´ s circle pictures.

Just a few percentage points behind Gun Runner in this category is leading second crop sire Not This Time, who topped this category in 2020 with a 23.4% clip. So with two full seasons of juvenile racing data, it is safe to say that Not This Time 2-year-old runners deserve an extra long look.

What was surprising looking at the 2021 numbers was the dearth of sires generating flat bet profits. In 2021, only the Cairo Prince juveniles showed a positive Win Return ($57.30). This compared with 2020 when a quartet of stallions showed a flat Win bet profit, led by Not This Time ($82.50).

MONDAY MYTHS: IT’S EASIER TO HANDICAP SHORTER DIRT SPRINTS


January 3, 2022 | By Jeremy Plonk/www.horseplayernow.com
Originally published on www.xpressbet.com

Welcome to a continuing handicapping series for our Monday blog space, “Monday Myths.” Each week I’ll use the power of the Betmix database to take common handicapping assumptions and either support or dispel them with data. Betmix data powers the 1/ST BET app and its features like Angler and Birddog give data-minded horseplayers a treasure trove of information in which to query your own curiosities.

Assumption:

It’s easier to handicap shorter dirt sprints.

Background:

They aren’t the most glamorous races nor at the high-profile tracks, but many handicappers believe that short dirt sprints are the easiest place to find a winner. They’re the bastion of the old expression that the race is won by the fastest horses. Is it easier to identify whose fastest in these races, and does that result in more wins?

Data Points:

I ran the Betmix database for every race in the country from Jan. 1, 2018 through today. I looked at races at 4-1/2 furlongs and shorter, 6 and 7 furlongs, and 1 mile to 1-1/8 miles – essentially dashes, sprints and routes.

//

Favorites won 42% in dirt dashes at 4-1/2 furlongs or less.
Favorites won 39% in dirt sprints at 6 to 7 furlongs.
Favorites won 37% in dirt routes at 1 mile to 1-1/8 miles.

//

The average price winner in dirt dashes at 4-1/2 furlongs was 4.2-1 odds.
The average price winner in dirt sprints at 6 to 7 furlongs was 5.3-1 odds.
The average price winner in dirt routes at 1 mile to 1-1/8 miles was 4.7-1 odds.

//

In claiming races, favorites won 43% in dirt dashes at 4-1/2 furlongs or less.
In claiming races, favorites won 37% in dirt sprints at 6 to 7 furlongs.
In claiming races, favorites won 37% in dirt routes at 1 mile to 1-1/8 miles.

//

In claiming races, the average price winner in dirt dashes at 4-1/2 furlongs was 4.2-1 odds.
In claiming races, the average price winner in dirt sprints at 6 to 7 furlongs was 5.1-1 odds.
In claiming races, the average price winner in dirt routes at 1 mile to 1-1/8 miles was 4.8-1 odds.

Overall Findings:

Dirt dashes had the highest win percentage and the lowest average odds winners, both by decided margins. The favorites won 3-5% more often in dirt dashes vs. dirt sprints and routes. The winners’ average odds in dirt dashes by between a half-point and just over a full point. When it comes to ‘cheap speed’ dirt dash favorites won 6% more readily than other races on the main track. The average price winner also was less among claiming dirt dashes.

Bottom line:

No doubt that the shorter the race, the more clarity in the results on dirt. If you’re barking up the cheap speed tree, than you can also say that the winning favorites in dirt dash claimer is even stronger with a bigger spread than other dirt races. These numbers affirm the assumption dirt dashes are easiest to handicap.

You can go into Betmix and run your own queries for a deeper dive into this theory and any that you can create. For instance, check how the tracks you handicap vary throughout the various distances.