Category Archives: Handicapping Blog

Pedigree Handicapping – 2021 Turf Sires

It was another fantastic season of grass racing across North America in 2021.

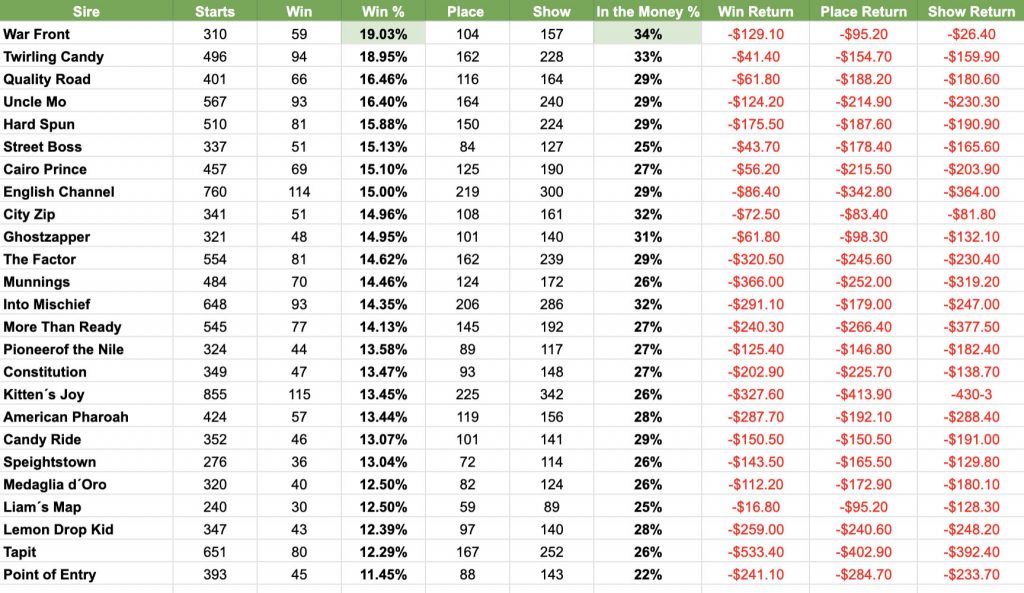
Below are the results of our annual Betmix Angler online handicapping database survey of the year´´´ s leading grass sires.

The Claiborne Farm stallion War Front was a dirt sprinter/miler in his racing days but, like many stallions from the Danzig sire-line, his runners are incredibly adept when competing on the green. He lead all sires last year with a 19% Win % with Twirling Candy and Quality Road right behind him.

In terms of In the Money %, War Front is also tops with a 34% rate followed again by Twirling Candy at 33%. The great Into Mischief is getting more and more turf runners as evidenced by his 32% In the Money clip. City Zip (32%) and his half-brother Ghostzapper (31%) are the other stallions whose grass runners hit the board at least 30% of the time in 2021.

MONDAY MYTHS: DO JOCKEY CHANGES MAKE A DIFFERENCE?


January 10, 2022 | By Jeremy Plonk/www.horseplayernow.com
Originally published on www.xpressbet.com

Welcome to a continuing handicapping series for our Monday blog space, “Monday Myths.” Each week I’ll use the power of the Betmix database to take common handicapping assumptions and either support or dispel them with data. Betmix data powers the 1/ST BET app and its features like Angler and Birddog give data-minded horseplayers a treasure trove of information in which to query your own curiosities.

Assumption:

Jockey changes can make a significant difference.

Background:

Jockeys are like Quarterbacks in football – they probably take too much blame for a loss and get too much credit for a win. But you can’t watch a race around a group of people without some comment about the riders pre-race and post-race. So how much impact do they have when a rider change is made from race to race?

Data Points:

I dialed up the Betmix database for all races in 2021 and studied the horses who made a jockey change from their previous race. I measured the jockey change as positive or negative based on bob riders’ win percentages. I looked at various class levels to see if jockey changes meant any more or less with the quality of horses.

Overall Findings:

Horses moving from a higher percentage jockey to a lower percentage jockey won 10.3% with $0.74 ROI.
Horses moving from a lower percentage jockey to a higher percentage jockey won 13.7% with $0.77 ROI.

//

Maiden claiming horses moving from a higher percentage jockey to a lower percentage jockey won 10.8% with $0.71 ROI.
Maiden claiming horses moving from a lower percentage jockey to a higher percentage jockey won 14.2% with $0.77 ROI.

//

Maiden special weight horses moving from a higher percentage jockey to a lower percentage jockey won 11.2% with $0.78 ROI.
Maiden special weight horses moving from a lower percentage jockey to a higher percentage jockey won 13.1% with $0.69 ROI.

//

Claiming horses moving from a higher percentage jockey to a lower percentage jockey won 11.1% with $0.75 ROI.
Claiming moving from a lower percentage jockey to a higher percentage jockey won 14.1% with $0.80 ROI.

//

Allowance moving from a higher percentage jockey to a lower percentage jockey won 10.9% with $0.67 ROI.
Allowance moving from a lower percentage jockey to a higher percentage jockey won 13.9% with $0.72 ROI.

//

Stakes horses moving from a higher percentage jockey to a lower percentage jockey won 9.1% with $0.66 ROI.
Stakes horses moving from a lower percentage jockey to a higher percentage jockey won 12.9% with $0.77 ROI.

Overall Findings:

At each class level and overall, horses going from a lower to higher percentage jockey increased their chances of victory by about 3% overall in strike rate. The findings and gap between the positive and negative jockey changes remained very consistent across the various class levels. And even though the presence of a better jockey would by assumption keep the price down on the return bid, the overall ROI for this positive jockey move still rates better than a step down in jockey in terms of value.

Bottom line:

Horses making a positive rider change aren’t automatic bets, but they’re certainly better bets than those that are going from a higher percentage jockey to a lower one. Overall, it’s safe to say a jockey change can make a statistical difference. You can go into Betmix and run your own queries for a deeper dive into this theory and any that you can create. For instance, check which trainers are more potent when changing jockeys or which tracks these kinds of moves are more or less successful.

Pedigree Handicapping – 2021 Juvenile Sires

The 2021 juvenile racing season officially came to a close when the ball dropped on New Year´ s Eve. With the data finalized, we took the Betmix Angler online handicapping database for a spin to see if we could gain any insights for the 2022 season.

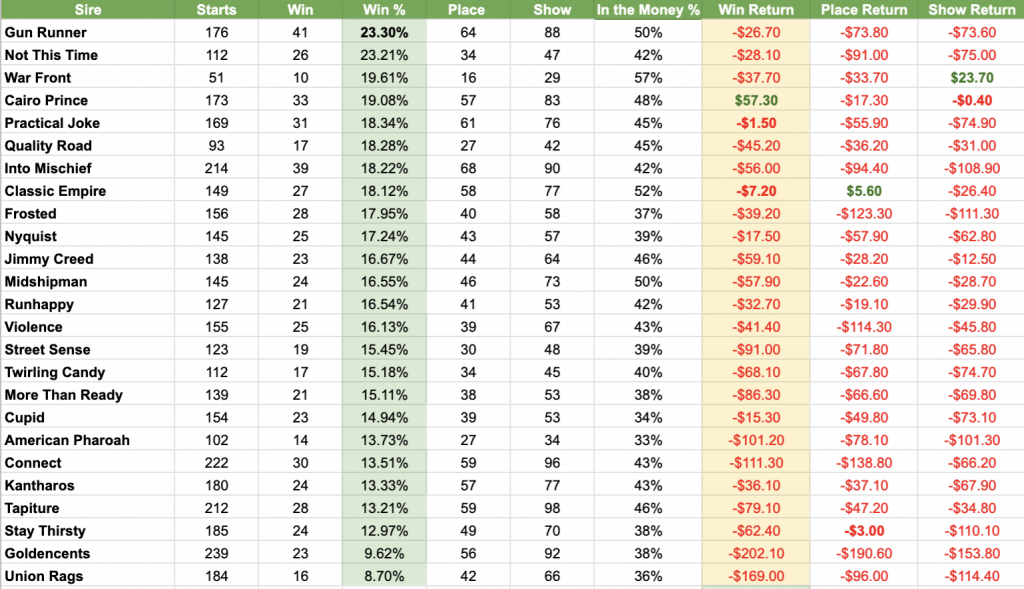
Gun Runner burst on the scene as a potentially important sire for breeders and Angler tells us he ranks first among all of the 2021 Top 25 Juvenile Sires (by progeny earnings) in terms of Win %.

As the chart below indicates, a little over 23% of the starts by his first crop runners resulted in a winner´ s circle pictures.

Just a few percentage points behind Gun Runner in this category is leading second crop sire Not This Time, who topped this category in 2020 with a 23.4% clip. So with two full seasons of juvenile racing data, it is safe to say that Not This Time 2-year-old runners deserve an extra long look.

What was surprising looking at the 2021 numbers was the dearth of sires generating flat bet profits. In 2021, only the Cairo Prince juveniles showed a positive Win Return ($57.30). This compared with 2020 when a quartet of stallions showed a flat Win bet profit, led by Not This Time ($82.50).

MONDAY MYTHS: IT’S EASIER TO HANDICAP SHORTER DIRT SPRINTS


January 3, 2022 | By Jeremy Plonk/www.horseplayernow.com
Originally published on www.xpressbet.com

Welcome to a continuing handicapping series for our Monday blog space, “Monday Myths.” Each week I’ll use the power of the Betmix database to take common handicapping assumptions and either support or dispel them with data. Betmix data powers the 1/ST BET app and its features like Angler and Birddog give data-minded horseplayers a treasure trove of information in which to query your own curiosities.

Assumption:

It’s easier to handicap shorter dirt sprints.

Background:

They aren’t the most glamorous races nor at the high-profile tracks, but many handicappers believe that short dirt sprints are the easiest place to find a winner. They’re the bastion of the old expression that the race is won by the fastest horses. Is it easier to identify whose fastest in these races, and does that result in more wins?

Data Points:

I ran the Betmix database for every race in the country from Jan. 1, 2018 through today. I looked at races at 4-1/2 furlongs and shorter, 6 and 7 furlongs, and 1 mile to 1-1/8 miles – essentially dashes, sprints and routes.

//

Favorites won 42% in dirt dashes at 4-1/2 furlongs or less.
Favorites won 39% in dirt sprints at 6 to 7 furlongs.
Favorites won 37% in dirt routes at 1 mile to 1-1/8 miles.

//

The average price winner in dirt dashes at 4-1/2 furlongs was 4.2-1 odds.
The average price winner in dirt sprints at 6 to 7 furlongs was 5.3-1 odds.
The average price winner in dirt routes at 1 mile to 1-1/8 miles was 4.7-1 odds.

//

In claiming races, favorites won 43% in dirt dashes at 4-1/2 furlongs or less.
In claiming races, favorites won 37% in dirt sprints at 6 to 7 furlongs.
In claiming races, favorites won 37% in dirt routes at 1 mile to 1-1/8 miles.

//

In claiming races, the average price winner in dirt dashes at 4-1/2 furlongs was 4.2-1 odds.
In claiming races, the average price winner in dirt sprints at 6 to 7 furlongs was 5.1-1 odds.
In claiming races, the average price winner in dirt routes at 1 mile to 1-1/8 miles was 4.8-1 odds.

Overall Findings:

Dirt dashes had the highest win percentage and the lowest average odds winners, both by decided margins. The favorites won 3-5% more often in dirt dashes vs. dirt sprints and routes. The winners’ average odds in dirt dashes by between a half-point and just over a full point. When it comes to ‘cheap speed’ dirt dash favorites won 6% more readily than other races on the main track. The average price winner also was less among claiming dirt dashes.

Bottom line:

No doubt that the shorter the race, the more clarity in the results on dirt. If you’re barking up the cheap speed tree, than you can also say that the winning favorites in dirt dash claimer is even stronger with a bigger spread than other dirt races. These numbers affirm the assumption dirt dashes are easiest to handicap.

You can go into Betmix and run your own queries for a deeper dive into this theory and any that you can create. For instance, check how the tracks you handicap vary throughout the various distances.

December Handicapping Myths

Xpressbet.com & Horseplayer.com's Jeremy Plonk has been using the Betmix online handicapping database to investigate some common handicapping myths. Read & click below for his discoveries during December.

ARE 1-TURN MILES ABOUT SPEED OR STAMINA?

Are one-turn miles are more about speed than stamina?

Read more

BETTING EARLY SPEED ON THE DISTANCE CUT-BACK

Are early speed horses successful when shortening distances?

Read more

SNOWBIRDS RULE GULFSTREAM EARLY?

Do New York runners have the Gulfstream Park advantage as the snow birds head south for winter?

Read more

WHEN DO WE FIND CLARITY IN THE 3-YEAR-OLD PICTURE?

The 3-year-old stakes picture takes some time to gain focus through the winter and spring.

Read more

CAN PRAT & RISPOLI BE BEATEN ON TURF IN SOCAL?

Can you beat Flavien Prat and Umberto Rispoli in Southern California turf races?

Read more

Sharp Angles – Smarty Jones S.

Smarty Jones S. at Oaklawn Park
8F on Dirt (January 1)

Horse Racing Data Analyzed: Last 34 8-furlong non-graded main at Oaklawn
Date Range: January 1, 2012 - Present
Sharp Angle: Ranked 1st Avg. of Last 3 E2 Pace
Factor Stats: 35 contenders, 11 winners (31%) $57.00 Win Return, (181 ROI%), 18 Place (51%) $33.40 Place Return, 24 Show (68%) $13.60 Show Return

Here we go! The 2022 Kentucky Derby trail officially kicks off with a quartet of Saturday points races for the nearly-turned sophomores.

The Smarty Jones at Oaklawn Park honors the 2004 Derby/Preakness champ and has drawn the largest and most competitive field among the four New Year´ s Day preps.

The Betmix Angler online handicapping database tells us that Avg. of Last 3 E2 Pace has been highly predictive and lucrative in the 8-furlong listed stakes in Hot Springs. Three of the past five Smarty Jones winners have ranked first in this handicapping factor and the overall numbers are compelling - a 31% strike rate and across the board positive returns.

Find this race in Betmix Birddog and use the Avg. of Last 3 E2 Pace slider to see which horse ranks first in this factor. That’s the Sharp Angles play.

Want to look for your own Angles using Betmix handicapping software?
Click for the Betmix Angler tutorial
Click to subscribe to Betmix

MONDAY MYTHS: CAN PRAT & RISPOLI BE BEATEN ON TURF IN SOCAL?


December 27, 2021 | By Jeremy Plonk/www.horseplayernow.com
Originally published on www.xpressbet.com

Welcome to a continuing handicapping series for our Monday blog space, “Monday Myths.” Each week I’ll use the power of the Betmix database to take common handicapping assumptions and either support or dispel them with data. Betmix data powers the 1/ST BET app and its features like Angler and Birddog give data-minded horseplayers a treasure trove of information in which to query your own curiosities.

Assumption:

You can’t beat Flavien Prat and Umberto Rispoli in Southern California turf races.

Background:

The dominant turf-riding duo of Flavien Prat and Umberto Rispoli are like magnets when you handicap a Southern California grass race. Often it’s the first place the public looks in the past performances.

Data Points:

I studied every turf race in Southern California in 2020 and 2021, more than a thousand strong at Santa Anita and Del Mar.

//

Prat and Rispoli won 386 of the 1095 turf races offered (35.2%).

//

Prat and Rispoli rode 542 of the 1095 favorites in turf races offered (49.5%).

//

Prat had a 24.8% win rate and $0.83 ROI in turf mounts.

//

Rispoli had a 22.2% win rate and $1.04 ROI in turf mounts.

//

Only JJ Hernandez (16.6%) and Joel Rosario (16.1%) have won more than 15% on turf with 40+ mounts.

//

Prat and Rispoli won 72 of the 186 turf stakes races offered (38.7%).

//

Prat and Rispoli rode 92 of the 186 favorites in turf races offered (49.4%).

Overall Findings:

Prat and Rispoli rode a significantly higher percentage of favorites, nearly 50%, than they did winners, just over 35%, on the turf. The public certainly follows their runners in the spirit of the study’s original premise. Rispoli was the more profitable follow, in fact showing a flat-bet 4% profit over the past 2 years. All other jockeys in the colony win at a combined 7.7% rate on turf with only 2 jockeys hitting 15% or more with 40+ mounts.

Bottom line:

It’s a bit of hyperbole to say you can’t beat Prat and Rispoli on turf. In fact, nearly 2 in 3 times, they do get beat. But their comparative dominance over the other individuals in the colony is unmistakable and the public honing in on just about half the favorites on turf from one of these two riders is an indication that the feeling is pretty ingrained.You can go into Betmix and run your own queries for a deeper dive into this theory and any that you can create. For instance, see which class levels on turf and distances the duo has the most likelihood for victory, or to be upset.

MONDAY MYTHS: WHEN DO WE FIND CLARITY IN THE 3-YEAR-OLD PICTURE?


December 20, 2021 | By Jeremy Plonk/www.horseplayernow.com
Originally published on www.xpressbet.com

Welcome to a continuing handicapping series for our Monday blog space, “Monday Myths.” Each week I’ll use the power of the Betmix database to take common handicapping assumptions and either support or dispel them with data. Betmix data powers the 1/ST BET app and its features like Angler and Birddog give data-minded horseplayers a treasure trove of information in which to query your own curiosities.

Assumption:

The 3-year-old stakes picture takes some time to gain focus through the winter and spring.

Background:

With the turn of the calendar, many will turn their attention to the Triple Crown trail. It’s the most identified ‘season’ in horse racing and culminates in May and June. The months of January through April are when the class of each year’s class comes to the top. But do those stakes races in the ‘regular season’ get easier or harder to handicap as the 3-year-old crop defines itself?

Data Points:

I dialed up the Betmix database for all 3-year-old graded stakes races for the colts/geldings over the last 8 years, going back to 2013. I wanted to see what the average price winner was in those races by month, January-February-March-April, as well as the percentage of winning favorites.

//

The average 3-year-old graded stakes winner in January is 1.90-1 odds.
Favorites in 3-year-old graded stakes races win 59% in January.

//

The average 3-year-old graded stakes winner in February is 5.28-1 odds.
Favorites in 3-year-old graded stakes races win 33% in February.

//

The average 3-year-old graded stakes winner in March is 4.98-1 odds.
Favorites in 3-year-old graded stakes races win 37% in March.

//

The average 3-year-old graded stakes winner in April is 4.62-1 odds.
Favorites in 3-year-old graded stakes races win 32% in April.

Overall Findings:

January had the lowest-priced returns as well as the highest rate of winning favorites in the survey. The average winner nearly 2.72 to 3.38 odds points lower than any other month. The percentage of winning favorites was a whopping 22-27 percentage points lower than the other months. The February through April results did decrease in terms of average win payoff as the prep season unfolded.

Bottom line:

There’s some truth to the trail coming together from February to April, but the initial month of the year has been absolutely locked in on shorter prices while some of the bigger horses remain on the sidelines for their sophomore returns.

You can go into Betmix and run your own queries for a deeper dive into this theory and any that you can create. For instance, which track circuits on the 3-year-old trail follow this lead and which do not?

Sharp Angles – Tinsel S.

Tinsel S. at Oaklawn Park
9F on Dirt (December 18)

Horse Racing Data Analyzed: Last 19 9-furlong main track stakes at Oaklwn
Date Range: January 1, 2012 - Present
Sharp Angle: Ranked 1st Distance Pedigree Rating
Factor Stats: 21 contenders, 5 winners (23%) $15.80 Win Return, (137 ROI%), 8 Place (38%) $2.20 Place Return, 11 Show (52%) $5.40 Show Return

December racing at Oaklawn Park is brand new but the Betmix Angler online handicapping database has nearly 10 years now of racing data from the Hot Springs oval.

We put the data to the test to analyze Saturday´s inaugural Tinsel Stakes and found that the Distance Pedigree Rating handicapping factor has been fairly predictive in the 9-furlong stakes at Oaklawn. Horses ranking first in this more obscure handicapping factor have scored at a 23% rate while generating positive returns across the board.

Find this race in Betmix Birddog and use the Distance Pedigree Rating slider to see which horse ranks first in this factor. That’s the Sharp Angles play.

Want to look for your own Angles using Betmix handicapping software?
Click for the Betmix Angler tutorial
Click to subscribe to Betmix

MONDAY MYTHS: DO NYRA SNOWBIRDS RULE GULFSTREAM EARLY?


December 13, 2021 | By Jeremy Plonk/www.horseplayernow.com
Originally published on www.xpressbet.com

Welcome to a continuing handicapping series for our Monday blog space, “Monday Myths.” Each week I’ll use the power of the Betmix database to take common handicapping assumptions and either support or dispel them with data. Betmix data powers the 1/ST BET app and its features like Angler and Birddog give data-minded horseplayers a treasure trove of information in which to query your own curiosities.

Assumption:

New York runners have the Gulfstream Park advantage as the snow birds head south for winter.

Background:

December’s shift from north to south makes Gulfstream Park the place to be not only for the Floridians, but New York and Kentucky shippers as well. Most horseplayers consider the NYRA runners the class of the snowbirds and stronger than the year-‘round locals in South Florida. Let’s put the numbers against that.

Data Points:

I dialed up the Betmix database for December results at Gulfstream Park to see where the early season winners came from. Once we get into the New Year, the majority of starters will already have relocated and had a start locally. The early season barometer will be looked at not only for which circuits horses came from, but also at the various class levels to assess strength. I used the past 3 years (2018, 2019, 2020 and opening week of the 2021 Championship Meet). For NYRA shippers, they are horses who last raced at Aqueduct, Belmont or Saratoga; Kentucky shippers last raced at Churchill, Keeneland, Turfway, Kentucky Downs or Ellis Park; Florida locals last raced at Gulfstream or Gulfstream West.

//

In all races, NYRA shippers won 17.5% with an $0.88 ROI at Gulfstream Park in December since 2018.
In all races, Kentucky shippers won 18.1% with an $1.08 ROI at Gulfstream Park in December since 2018.
In all races, Florida locals won 10.0% with an $0.73 ROI at Gulfstream Park in December since 2018.

//

In maiden claimers, NYRA shippers won 18.2% with an $0.84 ROI at Gulfstream Park in December since 2018.
In maiden claimers, Kentucky shippers won 27.2% with an $1.55 ROI at Gulfstream Park in December since 2018.
In maiden claimers, Florida locals won 9.6% with an $0.80 ROI at Gulfstream Park in December since 2018.

//

In maiden special weights, NYRA shippers won 19.5% with an $1.16 ROI at Gulfstream Park in December since 2018.
In maiden special weights, Kentucky shippers won 17.8% with an $0.89 ROI at Gulfstream Park in December since 2018.
In maiden special weights, Florida locals won 6.2% with an $0.52 ROI at Gulfstream Park in December since 2018.

//

In claiming races, NYRA shippers won 15.4% with an $0.78 ROI at Gulfstream Park in December since 2018.
In claiming races, Kentucky shippers won 13.8% with an $0.55 ROI at Gulfstream Park in December since 2018.
In claiming races, Florida locals won 11.4% with an $0.73 ROI at Gulfstream Park in December since 2018.

//

In allowance races, NYRA shippers won 21.2% with an $0.81 ROI at Gulfstream Park in December since 2018.
In allowance races, Kentucky shippers won 17.9% with an $0.73 ROI at Gulfstream Park in December since 2018.
In allowance races, Florida locals won 10.1% with an $0.69 ROI at Gulfstream Park in December since 2018.

//

In stakes races, NYRA shippers won 14.2% with an $0.84 ROI at Gulfstream Park in December since 2018.
In stakes races, Kentucky shippers won 15.3% with an $1.49 ROI at Gulfstream Park in December since 2018.
In stakes races, Florida locals won 5.4% with an $0.39 ROI at Gulfstream Park in December since 2018.

Overall Findings:

The NY and KY raiders won at a higher percentage than the locals at every class level in our study with gaps anywhere from 2-17%. The Florida locals were most competitive in the claiming ranks. NYRA shippers rated best in 4 of the 6 class categories, while Kentucky led 2 – but Kentucky had the best win rate overall blended among the classes, thanks to total dominance in the maiden claiming ranks.

Bottom line:

The snowbirds absolutely have the edge, but it’s Kentucky on equal or better footing overall than NYRA when it comes to December at Gulfstream.

You can go into Betmix and run your own queries for a deeper dive into this theory and any that you can create. For instance, see which trainers have had the most snowbird success this time of year at Gulfstream.