All posts by Dave Williams

Big Tournament Winners Talk About How They Use Betmix

If you follow horse racing tournaments with any regularity, specifically a contest site called HorseTourneys, you know about the four “major” tournaments that comprise their yearly Grand Slam. This year, two Betmix customers, Matt Bickey and Mark Stillmock, were big winners. Bickey won the Player’s Championship in April, pocketing $149,310 in the process. Stillmock won $158,331 the inaugural Pick and Pray Classic in November, while also taking down the HorseTourneys Grand Slam Series with three Top 10 finishes in the four events. Both players have won multiple regular Tour events over the past few years, as well.  With this year’s first major event coming this weekend, the Flo-Cal Faceoff on Feb 1-2, we invited both to participate in a written Q & A about the ways in which they use Betmix, and both were kind enough to oblige. We thank Matt and Mark for their time and hope that their generous insights will help you all win a few tournaments this year!
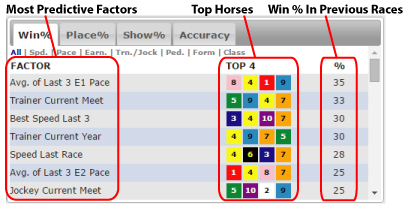
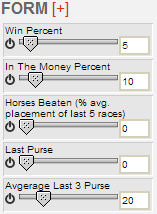
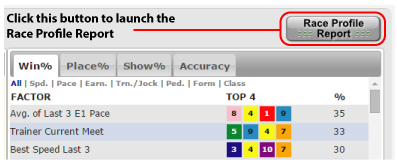
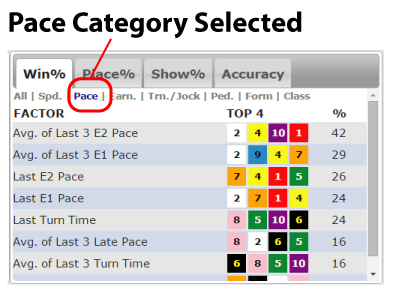
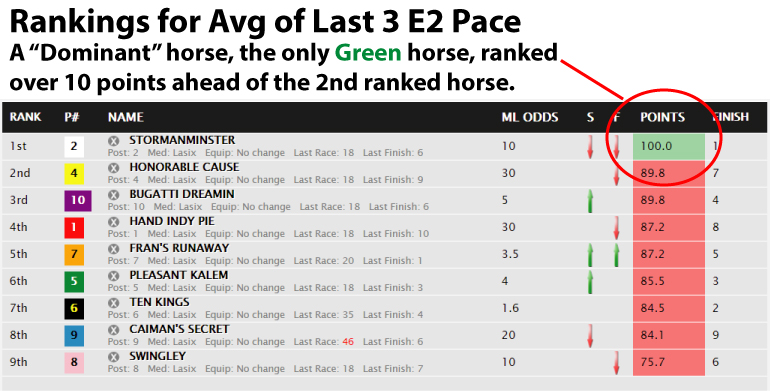
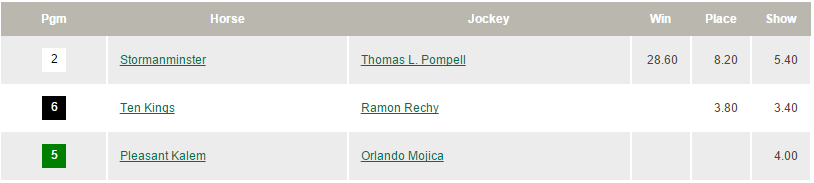
General Software Origin, Use & Strategy: BETMIX: How did you come to use Betmix? 

MB: (Matt Bickey) I make media, and occasionally trawl the internet for archival footage of things, and remixes of songs. I do periodic searches of words like "footage" and "mix" and scroll deep to see what they bring up. In an odd collision of my interests, my search for media brought me to Betmix. Up until that point I was a paper handicapper using BRIS products, and, on big days, using their ALL-WAYS software. When I found Betmix, I tested it for a couple of months before moving to it full-time. This was when you had what you now call the Legacy tools, before the development of Birddog and Angler. 

MS:  [Mark Stillmock, P.E.] Dave, I do not remember exactly. I know that I became disenchanted with a competing product as I believe they were tweaking things, and it affected my selections. I believe I saw the ad in Xpressbet. I went to the site, and I liked the database style of organization, and the amount of information and I thought it would work for how I handicapped.  

BETMIX: Betmix offers a vast array of data and features. Can you walk me through your typical workflow when using the software to prepare for a tournament day?

MB:  Anyone who knows me knows that I think race selection is the Holy Grail, especially at an event like the National Handicapping Championship (NHC), but my usual day involves playing pick-and-pray events at HorseTourneys. In that case, the races are picked for you, so the first thing I usually do is pull each race up in the Birddog module and evaluate the favorites using a couple of my basic mixes. Mine are built around speed and pace figures, but for those just beginning, looking at factors with high percentages in the Top 4 column may be enough. What I am usually hoping for is races that have less than a 10-point difference in my mixes from top horse to bottom horse. Those races usually aren’t won by the favorite, and many times, produce a price. 

MS:  I determine what races are included in the tournament.  
I write down the track, the race number, and the type of race, MC, MSW, ALW, etc. and each horse. 
Then I open Birddog, I analyze the race qualifying each horse based on whether it has a positive ROI in the owner stats, trainer stats, jockey stats, or sire stats. I circle any horses that have a positive ROI. My default sort is for positive ROI’s.Next, I look at the class analysis and determine which horses won their last time out, and I apply some handicapping to horse that won the last time out to qualify or disqualify them.
Next, I look at the quick handicapping buttons, factor groups, score and birddog, and mixbot, and I circle any horses that are not yet circled.
 I look at the factor statistics, I sort on a Win ROI with the highest ROI at the top, and I circle any horses that show up here that are not yet circled.
I look at the command center selections and I will circle any that have not yet been circled.
If I still have some horses that are left not circled, I will check to see if the show up in Twinspires pace and tips. If they do I will mark them TS, so I can keep track of how they do.
Then I will make my picks using my proprietary selection method.      


BETMIX:  How do you prioritize the different data points available in Betmix (speed figures, class ratings, pace projections, trainer stats, jockey stats, etc.)? Do you rely on specific modules, and if so, which ones do you favor?

MB:  The thing with Betmix is there are just so many ways to use it. You have built so many quality modules over the years, and I would have to say that the way I play now, is very different from the way I played, say even two years ago. As your product has evolved, so have I. I predominantly use Fusion, Birddog, PP View (which is inside of Birddog), and Angler in conjunction with one another. When you released Fusion, which is based on the exact number of starters in a race, it wrecked my game for a few months before I figured out what I was looking for through a lot of backward-looking studies. Everything started to click around April, just in time for the Player’s Championship. If I had to pick just one module, now it would be Fusion. But I always look at several different things to narrow down selections, especially if I am in a game with only one entry. 

MS: If the contest is $2 live WP and I am at the end and I need something with specific odds, I primarily focus on Mixbot and Factor Statistics. In pick and pray contests, my selections are already made. I developed my current methodology for $2 win and place contests, and I am happy with where I am at there. I am working on live bankroll contests to figure out how I want to use Betmix in them. So far, I am focusing on Mixbot, Factor Statistics, and the Command Center, I pay special attention to class and pace. 

BETMIX:  Do you utilize any custom filters or screens within Betmix to narrow down your contenders? If so, can you share some examples?

MB:  I do. I have 27 different mixes built in Fusion, and the consensus of those, which Fusion tabulates for me at the top of screen when “Load” is selected, has proven very powerful for me, especially in betting and live money games. I probably have hundreds of mixes built for individual tracks, distances and surfaces that I have made over the years, but honestly I only look at those now in a tie-breaking scenario. One example would be a mix I call “Hidden,” which is built around Days Since Last Race, Days Since Last Win, and Betmix’s proprietary class rating, in this case, showing a drop of 2 points or more. Many bombs have come from this simple mix in Fusion. 

MS: I do not, I have investigated them but found that the base Betmix data suits my needs better.

BETMIX:  How do you balance using the software's objective data with your own subjective handicapping insights and observations?

MB:  A lightbulb went on for me when I just eliminated my ego and accepted the fact that the data is smarter than I am. If you remember, I made t-shirts for my wife and I, and you, and some Betmix friends that said just that, and we wore them one day at the NHC last year. Many times, though, I will be between three or four horses, and I will use various things to break the tie. One of my favorites is to go into PP View in Birddog, and use the sliders to look at just the last year of races at roughly this distance and Betmix class, and see who gets kicked out. 

MS:  In pick and pray, and live $2 contests, I stay with my picks, and I do not try to second guess myself. If the horse qualifies, it qualifies. I will only change things towards the ends of live $2 WP contests, and only if my initial selection does not meet the odds that I need.   

BETMIX:  Betmix allows for creating "angles" and “mixes.” Do you use any pre-built ones? What are their key components?

MB:  As I mentioned above, I have a great many. Their components depend on the kind of race. Any race with firsters, or second-time starters, I only use Trainer, Jockey, Pedigree, and Owner, Owner/Trainer combo info. Betmix is great for that. I haven’t run across many other software suites that give you as much info on Owners as Betmix does. Races where horses have a lot more starts, and data, I put a lot of stock in the-top-to-bottom mixes I have built. They usually involve mostly class, speed and pace factors. 

MS:  
I do not, I have investigated them but found that the base Betmix data suits my needs better. 

BETMIX: Live-money tournament play requires managing a bankroll effectively. Does the Toteboarding module in Betmix inform your betting strategy in terms of wager type and amount?

MB:  The imputed odds from the Daily Double and Pick 3 pools are invaluable. But honestly, that is about all I look at. Once the race is off though, I always have Toteboarding open so I can see what the final exacta payouts are going to be.

MS: I do not use the Toteboarding feature. 

Specific Feature Focus: BETMIX:  Betmix offers advanced past performance data. Are there specific data points within the past performances that you find particularly insightful when using the software?

MB:  I am a huge fan of the PP View in Birddog. When I am telling a paper handicapper to check out the software for the first time, that is where I tell them to go first, because it looks somewhat like what they are used to. But its sortability is so powerful, and addictive, and the way it averages whatever is left on the screen is something. Example: set the slider for distance to exactly 6 furlongs, and the average speed par for the race alters to suit that, and horses that have never gone that distance disappear (I usually go a half furlong either way, by the way). It can really change the way you look at a race. And then, with regard to any factor, I look for what I call “the gap.” If a horse has a five-point advantage in any significant factor, like, say, Average Speed Best 2 of Last 3, it shouldn’t be ignored. 

MS: I have just started looking at them, I am trying to determine if I can use them in Live bankroll tournaments. 

BETMIX:  Do you utilize Betmix's pace projections and how important are they to your handicapping process?
MB:  That is a tool that I don’t use. I do look for those aforementioned gaps of five points in all the e1 and e2 factors, though. 

MS:   I will occasionally look at E1 or Late, to give me a quick graphical what the pace setups is.

BETMIX:  How much emphasis do you place on Betmix's trainer and jockey statistics? Are there specific stats you look for, or do you use the overall ratings? 

MB:  As I mentioned earlier, quite a bit in any race with a firster or second-time starter. But I add in some pedigree and owner stuff as well. I don’t favor any of the trainer/jock stuff, specifically. I consider all those factors, with particular attention paid to win and place percentage.

MS: They are integral to me selecting horses to be qualified. 

BETMIX:  Does Betmix’s proprietary class and/or speed information influence your selections, and if so, how?

MB:  Again, in races where the horses have had a lot of starts, class and speed become vitally important. I especially love Betmix’s class rating. Many times I see a horse that appears to be rising in class by the race type, as in something like a 7500 CLM to 10000 CLM, but in Betmix, he will actually be on a two-or-three-point drop. I call that the “Hidden” drop. I especially love that scenario when that horse is the only horse with the highlighted-green class-drop indicator. 

MS: Yes, the class affects how I evaluate previous winners, if they are the top class I will qualify them. If the winning horse does not meet any of my criteria, or the Betmix class, I will check the Factor Statistics to see if the horse is tops in any speed category, if it is, it qualifies.  

Tournament-Specific Strategies:BETMIX:  In a high-pressure tournament environment, how do you avoid "over-thinking" the data presented in Betmix? 

MB:  Easy answer. Trust the data. It is right way more often than I am with my subjective opinion. Also, choose wisely. That is the hardest part, lol. Also, many years ago, when I was first getting serious about handicapping, I read Brad Free’s book “Handicapping 101,” and he said something in it that I still say to myself in just about every tournament situation: “be bold, or be wrong.” 

MS:  I try to stay with my original picks in $2 WP live tournaments until the end when I may need something with specific odds to get me where I want to be. As for Live Bankroll tournaments, I am still developing how I want to use Betmix’s vast amount of data. 

BETMIX:  Do you use Betmix differently when playing in a live-bankroll tournament versus a mythical-money tournament? 

MB:  I don’t. It took me 10 years to become a good handicapper, and probably another 10 years to become a good gambler. Tournament play really did help me hone my game to being able to focus on one or two horses, and then a fellow who goes by the name of Inside The Pylons on Twitter, really helped me on the wagering side. I am sure I still don’t bet as efficiently as he would like, but I do pretty well. I heartily recommend anyone seek out any podcast he has done and really listen. If he rankles you, you’re probably playing incorrectly. The thing about live money tourneys is that it is about being good on that day. So I skew a little broader to improve my strike rate, and the way my game is designed, I will always have some kind of play at the end that will put me in contention. 

MS: Yes, to win you need some big numbers, you have to choose when and where to take a chance, one of the Betmix factors that I use is the longshot score for the race or sorted by the longshot score in the command center. I also use a database that I developed a few years ago tracking which races had the highest ROI’s and between that and Betmix I decide where to take my chances.

BETMIX:  Were there any specific races in the tournament where Betmix proved particularly crucial to your success? Can you walk me through your thought process in those instances? 

MB:  Oh, God yes. Every big score I have had in the last 10 years. That HorseTourneys Breeder’s Cup Day tournament win in 2020 for 35k is what kind of moved me to the next level. And then, of course, the 149k win last April in the Player’s Championship. Betmix has been central to everything I have won since I found you in 2013, so thank you a million times over for creating it! As for my thought process with tournaments…it really doesn’t change. I like to do all the work, and have my selections put in before the post of the first race of the contest. This is because I mostly play lockdowns. I prefer them. Live win/place mythicals become dart-throwing contests a lot of times if someone scores early. It is so much better to have a bomb early rather than late in those, but even in Live WP mythical, I have all the work done before the first contest race. 

MS: It is integral to all my qualifying horses, so any winner that I picked, it was crucial to its selection. 

BETMIX:  Longshots are the key to tournament success. Without divulging any secrets, can you tell me how you use Betmix to find those longshots in tournaments?

MB:  Well, I feel like I have sprinkled a few throughout the course of this, but I remember sitting with a really good player back at one of the first tournaments I ever played, a 3-seat NHC qualifier at Colonial Downs. I had a middling score of 50 bucks. I knew he had qualified multiple times before, and asked him if he would look at my plays (this is so far back…you wrote them on a triplicate carbon copy, submitted the white and yellow sheets in two different bins, and kept the pink one). He looked at them for two minutes, and said: “you can’t have longshots if you never take any, and you have to have longshots to play correctly.” This gentleman was the first to tell me that when you whiff in a contest, it usually means that your game theory is correct. You are playing in a manner that will win a tournament. It just didn’t win that day. Many, many players I meet never venture out past 12-1 morning lines. They would certainly never take a 30-1 morning line horse. The only way they catch a cap horse is if it gets lost on the board from 8-1 morning line or something. The process, for me, is: evaluate the favorite, and second choice, as well. Do you believe in them? If not, go to the longest-odds horse in the field and start working backward. As far as how I use Betmix, perhaps I shouldn’t give this away, but Win ROI is vastly more important to me than Win percentage. So, I sort everything I look at by Win ROI, and usually build mixes of those factors around any of them with an advantage of 4 points or more. This is why you so rarely see me on anything under 6-1. Although, I am trying to force myself into a mindset where if I see a horse just lays over the field, take the seven dollars and move on. This is something I really admire about Mark Stillmock’s play. I look at his selections, and mixed in with the bombs, he will have some really logical horses. That guy is on fire. I am kind of jealous, actually, not being the best user of Betmix at this moment, lol. I look forward to his answers in this space. 

MS: Like I said before, I use Betmix as my primary horse qualifying tool, and then I use my proprietary selection method for making my final selections. I will use specific Mixbot and Factor Statistics if I need a long shot at a specific point in a tournament.   

Future Development:BETMIX:  Are there any features you'd like to see added to Betmix to further enhance its usefulness for tournament players?

MB:  Not to beat on a drum that I have told you privately, but I would love to see the Command Center module updated. After Handicapping Journal (which points out the big prices of the previous day, which I check out and back-handicap to see how those numbers could have been found), CC is the next thing I open. It gives a nice overview of where post times land, and its Longshot Score is part of my process. As I mentioned earlier, race selection is my personal Holy Grail. My dream is a Longshot score on 100-point scale, where a 51 means a better than coin-flip chance that the race will not be won by a favorite. A 1 means take the chalk, and a 100 means, bombs away. I have sought this for years, and it is part of the reason I have developed my own top-to-bottom mixes that aren’t meant to point to a winner, but rather a race that is more likely to produce a price. I do love how Betmix has never been a static product, and that is because of you. Every time you tell me a new module is in the works, I am excited to see what it will do. Birdog and Angler were a quantum leap from the legacy tool. Fusion was even better, after I figured out how to use it, than Birddog and Angler. I look forward to seeing what you come up with next.   

MS: When using the angler analysis to look at Owner Stats, Trainer Stats, Jockey Stats, and Sire Stats, it would be nice if they change if we make a change in the Factor Statistics, for example, if a track goes from fast to sloppy it would be nice to see the angler analysis change to reflect the now sloppy track. In Factor Statistics, it would be nice to show NA, or something similar when there is no horse qualified for that factor, instead of the 12345. When there is a 1x, 2b, or 3c factor statistics does not show the number, only an odd chiclet is shown and that can be challenging to figure out which horse it refers to.In the command center can you add the number of races that the longshot score is based on?I could not find it; I believe that I looked carefully but I may have missed it.If it is somewhere else, could you tell me where?Would it be possible to set up command center so that it will show the next days races, not just the current, and past two days?This last one would be nice to have, but it is not as important as the others. In the command center dials and selections, when the surface or track condition change, would it be possible to have the command center selections and dials change to match it?  

BETMIX:  Knowing what you know now, and having been as successful as you have been, what advice would you give to someone just starting to use Betmix for tournament play?

MB:  You can’t be great every time you play (another personal dream of mine, lol). Well, unless your name is Mark Stillmock the last few weeks! So, I would say, be patient. If you whiff, don’t get down. It probably means you are playing correctly. My eldest son is getting into the game, and one day will get serious once he is out of school. I have told him, put $300 in HorseTourneys, and play max entries in 100 $1 games. Track everything you do, and revisit every game you play. I know far too many players who just do the same thing every time they play, and they never look back at what led them to their selection, win or lose. It is a grind, but I only got good from looking backward, a lot. I still look back at my plays, every single day. And another great thing about HorseTourneys is, that on every weekend, you can see how the very best players in North America played. Track them. That $100 horse they had in the last…go back and look at that race and find out which Betmix module might have pointed you toward it. This is an illogical game, the greatest gambling game ever invented, if you ask me. Punching in a few numbers the right way, can change your life in under two minutes. It is well worth anyone’s time to get good at it, with or without becoming a great tournament player. Not to be over the top, but I look at the races as canvases, and Betmix as a collection of paints and brushes that can help you create masterpieces. 

MS:  Because of the large amount of information available in Betmix and the many ways to use it, you will need some time experimenting with it to determine what features fit you handicapping style. It took me around six months of tinkering to determine how I wanted to use it for $2 WP tournaments, and as I have said previously, I am still working on how to use it in live bankroll tournaments. What I did was keep track of mythical entries against the actual tournaments, that saves money and helps determine how you want to use Betmix.

How often does the favorite win a horse race?

On average favorites win about 35% of horse races.  But, that win percentage can fluctuate based on the distance, surface, class, etc. For example, favorites are more likely to win dirt races than turf races. Another thing that will obviously make a big difference in the win % of favorites is the number of horses in the race. Favorites will win more often in small fields than in races with a lot of other entrants.

We recently looked at a large sample of data in Angler for races that had 8 horses starting. These races contained all tracks, distances, surfaces, classes, etc. The only consistent thing was that they had 8 starters.

We wanted to look at each horse in those races based on their rank in terms of their final odds. The horse with the lowest odds is the favorite, and the horse with the highest odds was the 8th choice.

AnglerOdds


The table above shows you how often a horse runs better, worse or as expected.

If a horse was the favorite, they couldn't run better than expected (as they were expected to win) and the 8th choice couldn't run worse than expected (it was expected to finish last).

The favorites in these 8 horse races won 35.4% of the time and ran worse than that 64.6% of the time.  Worse could be anything from 2nd through 8th. The 2nd betting choice ran as expected (2nd) 20.7% of the time and ran better than expected 21.6% of the time and ran worse than expected (3rd through 8th) 57.7% of the time.

As you look through the table you will notice some interesting things:

The betting public is better at deciding which horse will win than which horse will finish last.

In races with 8 horses the winner will be among the top 4 betting choices 82% of the time.

Horses that are the 5th choice will run better than expected 45.9% of the time, which puts them on a lot of superfecta tickets.

While this information is not all that surprising, it should help you think in general terms about percentages and odds. If you want to make money betting on horses you need to be betting against the favorite in the races that it is going to lose, and as you can see that happens more often that not (64.6% of the time). If you are betting on a horse that is the 5th choice or higher you are only going to win about 18% of the time. A horse could be the 5th choice and have odds of 7:1 or it could be the 5th choice and have odds of 12:1 or more. So, when you consider the general percentage chance that you have of beating the public opinion make sure you are going to be paid accordingly if you are right.

Finding the value plays is the key, and using Betmix will get you there. Betmix angler will help you find value plays and give you answers to almost any statistical question you have about horse racing data.


A few new Betmix Handicapping Tools

Three new Betmix tools:

1. Updated Horse pop-up info
When you click on a horse's name in Betmix you will see that horse's PP info.  We have added several new things to that screen.

A. If the horse had a layoff of more than 45 days, you will see that number in RED by the date of the race. You can use this information to see how well a horse typically runs back from a layoff.

B.  The AVG speed rating for each horse in the race that has run at today's distance and surface.  Speed ratings that are better than AVG will appear in Green and races where the speed rating was below AVG will appear in Red. This is very useful information for judging what it will take to win today's race and will help you easily spot capable horses.

C. The top three finishers in each previous start for the horse, horses listed in BOLD are running in today's race.

D. Trip comments for each previous race.

Take a look at this in the Free Race of the Day.

2. Detailed Track Report

When you click the TRACK REPORT button on any race screen you will see a pop up window that contains valuable information about the races being run at that track.

A. Winning posts positions for Dirt Sprints (less than a mile), Dirt Routes (mile or longer), Turf  Sprints and Turf Routes.

B. Information about what winning horses in each race type are paying.

C. The percentage of favorites that are winning each race type.  In the example above for Gulfstream West, you can see that there have been 205 races this meet and favorites have won 68 of those races (33%).  Dirt Route races have been the most predictable (40% favorites) and Turf Sprints have been the least predictable (26% favorites)

Take a look at this in the Free Race of the Day.

3. Sire, Trainer and Jockey report in the Handicapping Journal.

The Handicapping Journal is now listing data for Sires, Trainers and Jockeys.

List of the 10 sires with the most runners on the previous day, and current day. When you click on a horses name you will see detailed information about each runner sired by that stallion.  Where they ran, what type of race, purse, ML odds, finish position, purse money won, and $2 win bet pay out.  The information in the list is show a total for each horse.

The same information tables are available for the 10 trainers with the most runners and 10 jockeys with the most mounts.

Looking at this information will give you a better feel for what sires are producing the most winners, and what types of races they are doing well with.

Take a look at the Handicapping Journal everyday and see who is hot and who is not...

Quick handicapping method using Betmix

A Quick handicapping method using Betmix

There is a lot of information available in Betmix and its always helpful to take a look at some of the stats and features in a little more detail.
We often get questions about what certain things mean, or about how to use one of the tools.  Hopefully this handicapping method will explain some of the stats in more detail and give you some ideas on how to use BETPAD, one of our more popular tools.The TOP 4 stat and the ACCURACY stat 

The race profile stats contain information about how good each factor is at predicting the type of race you are looking at. There is information about Win%, Place%, Show %, Accuracy, Win ROI, Place ROI, Show ROI, TOP 4 and Advantage.  We get a lot of questions about Accuracy and TOP 4, so lets take a look at those in more detail.

The ACCURACY stat tells you how well a particular factor is at predicting the correct order of finish for the race.  If a factor had a score of 100, that would mean that the factor always predicted the correct order of finish for the top 4 finishers in the race - the top ranked horse always won, the 2nd ranked horse always ran 2nd, the 3rd ranked horse always ran 3rd, and the 4th ranked horse always ran 4th.  A cold superfecta every race!  Unfortunately, you will never see a factor with a score of 100...  However, factors that have an accuracy rating in the 30's and above are excellent to use when handicapping for exactas, trifectas, etc.

The TOP 4 stat tells you what percentage of the time a horse ranked in the top 4 for a particular factor wins the race.  Looking at the above screen shot, the factor Trainer Current Year has a TOP 4 score of 80%, which means that in the sample of similar races, a horse ranked in the Top 4 for Trainer current year won 80% of the time.  It is not unusual to see TOP 4 scores in the high 80's or even low 90's.  If you are a tournament player and are handicapping a race that has a factor with a high TOP 4 score you can feel very good about finding the winner in one of the 4 top ranked horses within that factor.
Each column in the factor detail table is sortable.  If you click on title of the column it will sort the factors from high to low. So, if you are looking for the factor that has the best Accuracy Score or Best Top 4 score, just click to sort and those will be at the top.
Using several factors in BetPad
Betmix is all about combining data, and using factors in combination to achieve a better overall result.  When you combine the best Accuracy Factor with the Best TOP 4 factor the results can be very powerful.  You can do that in a few ways (use the sliders) or you can click the Factor name within the table and it will be added to Bet Pad for you.
Its probably easier to watch how that is done than to explain it in an email, so take a look at this quick video to see how you can use a few key factors to come up with a very solid handicapping approach with just a few clicks.Combining Factors and Mixes in BetPad

Quick handicapping method using Betmix

Quick Handicapping Buttons

Quick_Handicapping

Available on both the desktop and mobile versions of Betmix, these buttons will give you a very accurate and quick way to handicap any race.

Clicking one of these buttons will create a mix for you based on the detailed race profile stats we compile for each race in Betmix.  Using these buttons individually or in combination can provide you with great handicapping angles in each race. As an example, if you are betting a superfecta, it would be a good idea to use the top ranked horse from each button.  If the top ranked horses are the same you can add the 2nd ranked horse to your tickets.


The TOP 10 button will create a mix based on the top 10 factors for the race type. It will give the most weight to the top ranked factor and a progressively smaller amount to every other factor in the top 10.  This is a good method for identifying the likely contenders in each race.


The WIN % button will create a weighted mix based on the factors that produce the highest percentage of winners. The highest weighted factor will be the one with the highest win %.  This button will identify a top win candidate.


This button will create a mix using factors that are good at identifying horses that will hit the board.  For each factor category (Speed, Pace, Earnings, Trainer Jockey, Class, Form, Pedigree) the factor that is most likely to predict a top 4 finish is weighted and used as part of the mix.  This is a great tool for finding a key horse for Trifectas and Superfectas.


This button creates a mix using the top factor in each category (Speed, Pace, Earnings, Trainer Jockey, Class, Form, Pedigree). The factors are weighted based on their overall rank.  Using this button will identify the most "balanced" horse in the race, the one that ranks highly in each factor category.


This button uses factors that have high WIN ROI$.  Factors with high can identify horses that are potential longshots.  If the highest ranked horse using this mix is going off at high odds, then it means that the horse fits the profile of the typical longshot winner of the race type you are handicapping.

Tips for handicapping Keeneland

A few mixes to get you started at Keeneland

The Keeneland Spring meet starts on Friday, and we have created a few mixes to help you get out of the gate quickly.
These mixes are based on the results of the Keeneland Fall meet that occurred in October of 2014, the first meet held on the the new dirt surface.
We have mixes for Dirt Sprint (races less than 1 mile), Dirt Route (1 mile and longer) and a Turf Route (1 mile and longer on the turf). There was not a large enough sample of races to create a Turf Sprint mix.  Please note that these mixes and results do not include any maiden races.If you are a monthly or yearly subscriber to Betmix you can find these mixes in theMix Library.

They are named:
Keeneland Dirt Route, Keeneland Dirt Sprint and Keeneland Turf Route
Go to Tools/Mix Library (https://betmix.com/mix-library/) and then select Keeneland in the track dropdown and hit the SEARCH button and all of them will show up.

The results for the mixes were pretty good, and should provide a great starting point for building out your Keeneland mixes for the Spring Meet.

Handicapping Angles

Another quick handicapping angle...

The information found in the Race Profile Statistics can be a gold mine if you use it in the right way. For those of you who are new to Betmix, we will quickly recap what those stats are and how they are created before showing you a quick way to find a likely winner.
The Race Profile Stats are created by looking at a group of races that are similar to what you are handicapping.  If you were handicapping a 6f Dirt Claiming Race at Gulfstream Park, the information in the Race Profile Statistics box would be derived from compiling information from up to the last 40 6F Dirt Claiming Races at Gulfstream Park.  It is information that is very specific to the race you are looking at.
We currently use 45 handicapping factors in Betmix, and each of those factors is ranked from best to worst.  You can see all of the factors ranked from best to worst, or you can pick a category (Speed, Pace, Earnings, etc) and view only those factors. Click this link to find more detailed information.
A quick handicapping method using these stats
We recently had to pull some data for a custom project we were doing and in the course of that process we uncovered some interesting stats about the profitability of betting horses who were ranked on top in certain factor groups.The data we were looking at consisted of 500 races (No maiden races) and contained dirt, turf, sprint and route races.  It was a completely random sample across many tracks and class levels, so keep that in mind when considering these results - they could be better or worse depending on the type of race you are looking at.Looking at the chart below you will see that we have statistics for various factors.  Some of them are single factors and others are in combination.  If you look at the very bottom of the chart you will see that betting the horse that ranked 1st in the best Class Factor for the race was the least profitable. There were 500 races in the sample, and if you had bet $2 to win on every single horse that was ranked 1st in the best class category you would have wagered a total of $1000 (500 x $2).  You would have won 82 of those races (16.4%), had a return of $771.00 on the bets for a loss of $229, or a return of -22.9%.  Not too good.  The best single factor in terms of win % was Speed, winning 26.2% of the time yielding a minuscule profit of $22.  Betting every horse that was ranked 1st in the best Trainer/Jock category you would have ended up with 24.8% winners (124 out of 500) but a much better profit of $189.

Where this gets interesting is when you look at the results for betting horses that were ranked 1st in two or more categories.  As an example, look at the combination "Pedigree & TJ". You will see that in the Bets column this combination only occurred 75 times in the 500 race sample: The horse that was ranked 1st in the best Pedigree factor was also the horse that ranked 1st in the best Trainer Jockey factor.  In the 75 races where that occurred, the horse won 28 times (37.3%) and provided a profit of $58 on your $150 investment for an ROI of 38.7%.
On the very top line you will see Pace, Pedigree and Form.  This combination only occurred 12 times in 500 races, but provided 10 winners (83.3%) and a fantastic ROI of 246%.
Looking down the list you will see various combinations along with their win% and ROI.  There are 35 different combinations of factors, some single, some double and a few triples.  29 of the 35 were profitable, but clearly the best combinations involved finding horses that were ranked 1st in two or more factors.  Those are not common situations.  Using this sample of 500 races you can see that only 12 times did the same horse rank 1st in the best factor within the Pace, Pedigree and Form category.  12 races out of 500 is about 2.5% so you should expect to find that particular combination about once in every 40 races you look at (excluding maidens).  We did not analyze every single combination of factors, just enough to illustrate the concept and provide you with some ideas on how to consider horses ranked on top in more than one factor.
A few handicapping angles using race profile stats.

The recently improved Race Profile statistics have generated a lot of feedback and enthusiasm. We have received several emails from users about how they use the stats to handicap and we wanted to share a few of those methods with you.It probably goes without saying, but please remember that nothing works 100% of the time. These angles are provided to give you ideas on how to use the stats and provide you with some inspiration for developing your own methods.

We have spot checked these and found them to be pretty good, but have not done any deep analysis to provide long term win/loss statistics.  Again, the purpose of these tips is to provide you with some ideas and perhaps give you a couple of new approaches to put in your handicapping toolbox.

#1 Finding A Single

If you make multi-race bets (Pick3, Pick4, etc.) you know how important it is to find a solid horse to use as s single to reduce the cost of the tickets.  This is simple method to use, and is great at identifying solid favorites that you should never ignore.
How to do it: Look at the top ranked horse in the overall rankings.  If that horse is also the top ranked horse in the top ranked factor it is a one star single.  If it is also the top ranked horse in the 2nd ranked factor it is a 2 star single, and so on. You're not going to find any longshots using this method, but if you are looking for a likely winner this is an easy way to spot one.
#2 High ROI/High Accuracy

We received this angle from a user who also provided a spreadsheet of each of his picks using this method at Gulfstream Park in January and part of February.  His results showed that he made 144 bets ($4 per play) for a total of $576.00. He had 74 wins (51.3%), and collected $980.00 for a ROI of 70.22%.  His average winning payout was $13.25.How to do it: Looking at the top 3 factors only, find the factors with positive Win ROI.  If more than one of those 3 factors have positive win ROI's then look at the Factor Accuracy score.  The factor with the highest Factor Accuracy is the one to use.  If none of the top 3 factors have positive ROI's then skip the race.  If the factor has a positive win ROI , but the factor accuracy is not above 30 skip the race.  When you have a qualifying race you bet the top 2 horses for that factor to win.

#3 Pace Advantage in a top factor

We've talked about this before, but when a horse has a big advantage in a pace factor you can't ignore it. The Race Profile statistics make finding those horses very easy, and can let you know when it matters.  If a horse has an advantage in a factor that is ranked very low overall its not meaningful, but when that factor is in the top 10 it can produce great results.How to do it: Click on the PACE filter to show only pace factors in the statistics box.  Look for a factor that is ranked within the top 10 and see if the top ranked horse has an advantage of 5 points or more.  If you find a horse that fits the bill, consider giving extra attention to that horse if it appears within the top four in one or more of the top speed factors.  A pace advantage combined with being competitive in speed is a winning combination.

#4 Top Factors in each category

In many races you will notice that most of the top factors come from one category - usually speed. When you put too much emphasis on one category your handicapping may be unbalanced.  An easy way to make sure that you get a comprehensive view of the race is to use top factors from each category. You can select the top factor in each category and add it to the BetPad, or you can give them a value with the sliders to create a mix. The values can all be equal, or you can weight them based on their win percentage.It may not be necessary to use the top factor from each category. If the top ranked factor in Pedigree is ranked 27th overall you can safely ignore that category all together.

#5 Use the last race

One user sent us this suggestion along with some documentation of how many exactas he played and hit.  Very impressive!How to do it: Click on the Races Tab to bring up a list of the races used in compiling the race profile stats

After clicking the races tab, you will see a list of all the races used to compile the date for this race type.  Click on the date of the most recent race and that race will open up in a new window in MixMaker.

When that race is loaded, look at the results and then look at the top ranked factors to find one that contained the top 3 finishers.

Now,look for the highest ranked factor that contained those top 3 horses.

Go back to the race you are currently handicapping and look at the top 4 horses for the factor you found, and box those in an exacta. Very easy, and the results were surprisingly good.

These are nice angles to use for quick handicapping, but in the long run you are going to have much more success creating mixes for specific race.  There is nothing wrong with using methods like this, they can produce good results and can be done very quickly.  Keep in mind that the purpose of sharing these angles is to show you that there is always more than one way to skin a cat, and at the end of the day the only thing that really matters is winning the race. It doesn't matter if you used a mix that took you 6 hours to develop, or if you used one of these quick methods.  Cashing a ticket is all that counts!
We hope that you find something useful in these angles and that they inspire you to start looking at the data in new and profitable ways.

How can a computer predict the result of a horse race?

Horse Racing Data

Analyzing the data is the key to solving the puzzle

When handicapping a horse race most people look at the relative abilities of each horse and judge them according to the past performance information they see in the racing program.  Information about where and what types of races each horse has been in recently, how fast the horse ran, the horse's running lines, information about the trainer and jockey and several other pieces of information can be considered by the handicapper as they try to figure out who will win. In a race with 10 horses you could potentially be considering several hundred data points for the field and managing that type of data load using only your head is extremely difficult.

Lets assume that you studied the racing form for 20 minutes and decided that horse #8 was going to win the race.  You place your bets - and as you predicted, #8 wins the race by 2 lengths and rewards you with a $10.00 win payoff. Congratulations!  Your work paid off, and now you are on to the next race.  You start the process all over again... Can you duplicate how you handicapped the last race again?  If you were only judging the horses by a few factors you probably could, but if you were considering multiple handicapping factors and assigning a different level of importance to each one it may be hard to analyze each race in the same way.  Or, the way in which you handicapped that winning race may not be the best way to handicap the next race.  If that race was a 6f dirt claiming race, and the next race is a 10F turf stakes race, chances are that you need to consider a different set of data points.

Which handicapping factors are important in each race type?

At a typical race track you have sprint races (races run at 7 furlongs or less) and route races (8 furlongs and longer - a furlong is equal to 1/8 of a mile).  Some are run on dirt, some on turf and some tracks have a synthetic all-weather surface.  You have maiden races, claiming races, allowance races, stakes and several other variations of class levels.  The factors that are important in one race may not mean much in another.

In order to determine the most predictive factors for each race, Betmix looks at all of the similar races in our database and ranks each individual factor in order for its ability to accurately predict which horse will win. As an example, if you were looking at 6 furlong Allowance Optional Claiming races run at Churchill Downs Betmix would be able to tell you that the most important overall factor for predicting winners is Last E2 Pace.  The next most important factor would be the average of the best 2 speed numbers from the horses last 3 races.  Betmix currently looks at 45 factors.  These factors represent data for Speed, Form, Earnings, Trainer/Jockey, Class, Pace and Pedigree. When you know which factors have historically been most predictive for the race you are looking at you can focus on those horses who are ranked highly in those areas.

Using the Betmix software to analyze with accuracy and consistency

After looking at the race you are getting ready to handicap and determining which factors are the most important you can begin to construct a Mix.  A Mix is combination of factors and weights that tell the computer how to handicap the race. If you think of a Mix as you would a recipe it might make more sense.  A recipe for a cake might call for eggs, flour, sugar and butter.  A Mix for a 8 furlong turf allowance race at Saratoga might call for Last Late Pace, Best Speed on Turf, Jockey Current Year, Turf Pedigree and Average of Last 3 Race Classes.  Think of the factors you need to use as ingredients in your handicapping recipe.  The weight (importance) that you assign to each factor would be similar to how much of the cake ingredients you used.  In baking a cake you could use the correct ingredients, but in the wrong amounts, and you would end up with a mess. Same thing holds true for handicapping a race.

Building your Mix using Betmix handicapping data

Its easy to determine which factor are the most important in handicapping a race - just look at the race profile stats on the Betmix screen
Predictive Handicapping Factors

The most predictive factors will point you in the right direction for adding the right "ingredients" to your mix, but you still need to know how much of each ingredient to use.  The amount that you would use is the "weighting" in Betmix.  As you build your mix you assign a numerical weight to each factor by using the sliders or by typing in a value by the factor name.

NewFactors

You can see a graphical representation of your mix, that shows you in a pie chart format how the factors are being weighted.

Handicapping Software analysis


How do you know if your Mix will work?

The best way to test a mix is to run it against several similar past races.  You will then be able to see how accurate the mix was.  How many times did the top ranked horse run 1st, 2nd, or 3rd? How many times did it hit the exacta or trifecta? Would you have shown a profit overall?

Testing your mix is easy.  When you are looking at a race, you can click the "Race Profile Report" button and that will launch a screen that shows you all previous similar races.
RaceProfileReportButton

After your profile report has launched you can apply a saved mix to that report, or create one on the fly.  The results box shows you how well your mix would have done for the group of races you are looking at.  Each time you make a change to your mix by either selecting a new factor or changing the weight of existing factors the results box will update.  The image below shows you the results of applying a mix to the last nineteen 8F dirt Allowance Optional Claiming races at Churchill Downs.

MixResults

You can see that after we applied our mix to the group of similar races we would have won 12 of 19 races.  If we bet $2 to win on each of those horses our total bet amount would have been $38 ($19 x $2) and we would have received $61.40 in winnings for a profit of $23.40.  If we would have boxed the top 4 horses in each race in a $1 Trifecta it would have cost us $456 ($24 x 19 races) and we would have won $589.40 for a profit of $133.40.

You can modify this mix on the fly to see how adding a factor or increasing or decreasing the weight of a factor effects your overall results.  When you think that you have created the ideal mix for this race type you can save it and then apply that mix to similar races in the future.  When you save a mix you can give it a name and also define it by racetrack, distance, surface and race type.  When you are looking at an upcoming race you can easily sort your mixes to find the best option for the current race based on those criteria.

The handicapping software at Betmix allows you to create mixes and test them against historical races to see if you are using the correct factors.  Since the computer is handicapping each race the exact same way (using the factors and weights you specified) you will not make errors and you will know that in future races you will be using the exact process that has worked for you in the past.

Experiment with Betmix by taking a look at the free race of the day, or learn more about how to use this handicapping software by watching some handicapping tutorials.


Find a Dominant Horse

Find a Dominant horse using the Race Profile Statistics

We introduced the Race Profile statistics a few weeks ago. You will see them at the bottom of each individual race page and they provide information about winning posts, average winner payout and details about the most predictive factors for each race:
profileimage
There is a lot of information contained in the Race Profile Stats, and many ways to interpret that data and use it to handicap. One of the many reasons that betting on horses is so intriguing and rewarding is that aside from winning money, there are numerous approaches that you can take to figure out the puzzle. Let's take a look at one way you can use those stats to find great betting opportunities.

Let's start by going over what the information within the Winning Factors box means.  When you look at the factors box you will see information about the most predictive Factors ranked by their ability to predict Win, Place, Show, and a tab called Accuracy that ranks the factors by their predictive ability to get the horses in the correct order from top to bottom.

For this method we are just going to focus on the Win % Factors.
WinFactorCategories

In the above example, I am on the Win % tab which shows the most predictive win factors, and I have clicked on the SPEED category which will display only the factors based on speed.

The race we are looking at is an 8f Dirt CLM race at Indiana Grand from yesterday. If you are a subscriber you can view the race as you follow along.

For 8F Dirt Clm. races at Indiana Grand, the most predictive Speed Factor is AVG SPEED LAST 3. Next to that you see the top 4 horses within that category (6,8,2,5) and the number 32%.  The 32% number means that over the sample of similar races that we have in our database, horses that are ranked the highest within that factor (Avg. Speed Last 3) win 32% of the time. The next most predictive factor is Avg. Best 2 of Last 3, and that factor has accurately predicted the winner 26% of the time.

Looking at the list of factors and the top horses within each factor you could assume that the #6 horse was going to be a major player in this race.  He is ranked 1st in the top 3 most predictive speed factors for this race type.  But, what you cant see by simply looking at the top 4 horses is how closely ranked they are.

In this race there were 3 scratches (#3, #11,#12).  If you are following along at home go ahead and scratch those horses from the race.

Now, lets turn on the factor for Avg Speed Last 3 and see how closely the horses are ranked (By "turn on", I mean give the slider for Best Speed Last 3 a value)
factoron
After moving the slider for Avg Speed Last 3, and giving it a value (Turning it "ON") we can see in the rankings view how closely the horses are ranked within that particular factor.
RankingSpeed

Although the #6 horse is ranked on top he is not "dominant".  There are 3 other horses that are very closely ranked within the factor Avg Speed Last 3. If you turn on the other most predictive speed factor (Avg Best 2 of Last 3) you will see 5 horses in Green.

Although the #6 is ranked on top within the 3 most predictive Speed Factors, he is not heads and shoulders above the rest of the horses. If that is the case then how much importance can you give those factors since there are so many closely ranked horses?

What this tells us is that there are a handful of horses in this race that are equally fast.  We know which speed factors are most predictive at finding a winner, but we cant be very confident in any one horse since they all have similar abilities.

IN A RACE WHERE SPEED SEEMS TO BE RELATIVELY EQUAL LOOK FOR A DOMINANT PACE HORSE. 

Now let's take a look at the Pace factors and see which one is most predictive:
PaceCategory
This chart shows us that the most predictive pace factor is Avg. of Last 3 E2 Pace. The top ranked horses for that factor are (2,4,10,1) and based on similar races the horse that is ranked on top within that factor wins 42% of the time.

When we "turn on" the factor for Avg. of Last 3 E2 Pace we see these rankings:avge2pace

The #2 horse, (Stormanminster) is ranked on top.  He has 100 points and the 2nd ranked horse has 89.8 points.  He is the only horse in "Green" and has a 10.2 point lead over the 2nd ranked horse.  When you have a horse with at least a 5 point lead over his rivals we consider that dominant.  In this case he is very dominant, having over a 10 point lead.

We know from the most predictive factor table for pace that the horse who ranks highest in Avg. of Last 3 E2 Pace wins 42% of the time, and we also know that the speed factors do not indicate a dominant speed horse.

The #2 horse won and paid a very generous $28.60.
INDrace4results

Look for dominant horses within highly predictive factors
In the above example, the #2 horse was the dominant horse for the Avg of last 3 E2 Pace category. From our race stats we know that factor was very predictive, pointing you to the winner 42% of the time.  If the factor was only able to predict the winner 20% of the time then a dominant horse would not be that important.

Speed and Pace are probably most important
When there are several equally matched speed horses finding a dominant pace horse is very helpful, and when the horses are evenly matched in Pace look for a dominant speed horse.  Finding a dominant horse in other categories like Pedigree, Form, etc. seems to be less important.  While those factor groups are valuable as part of a mix, they do not necessarily dictate how a race will be run.

We will be enhancing the Race Profile Statistics in the near future to indicate which factors contain dominate horses.  Until then it will take you a few clicks to figure it out on the screen.

We can't promise that this approach will work every time (nothing ever does!) but it is a very useful approach when analyzing a race.  To win consistently at the races you need an edge, and this approach can provide you with one.

Use Race Profile Statistics to help you handicap

The Race Profile Statistics Box

HorseRacingStatisticsBox
In every single race view in Betmix (Today's Races, Historical Races, MixMaker, Free Race of the Day) you will see the Race Profile statistics on the main screen just below the BetPad. All of the information in the Race Profile is based on similar runnings of the same race type at the track you are looking at.  In the above example the data shown is for the last 22, 8.5F Turf Allowance races atTampa Bay.You will see information about the winning posts for that race type, average payouts for winners, the most accurate factors for Win, Place, Show and Accuracy and the ability to sort those by Category (Speed, Pace, Earnings, etc). You can click the Race Profile Report button and that will launch a report that grabs those last 22 races for you (no need to build it in Create My Report). Let's look at each feature in more detail:

Winning Posts

Horse_Racing_Winning_Posts
This graphic will display the winning posts for this race type and allow you to determine if there is any bias. When looking at certain race types you may decide that the rail is the best place to be, or that a horse has the best chance of winning from the middle or outside. Mousing over any column will show you the number of winners for that particular post.  On the main display you will also see the Program number for each horse and their actual post if it differs from the program number.

Winning Payout

Horse_Racing_Winning_Payouts
The winning payout graphic will show you how often favorites or longshots win this race type.  It is broken down into four categories: $2.10-$6.00, $6.01 -$10.00, $10.01 - $20.00 and $20.01+.  This data will let you know if this is a race type that is predictable by the public or not. Longshot players can use this screen to find races that tend to produce longshot winners and focus their handicapping on finding a long horse with a big chance. In this example race type you can see that although the race is typically won by favorites, there is also a large number of winners that pay between $10.00 and $20.00.

Races

Races_Used
The Races tab will show you a list of all the similar races that were used to compile the race profile statistics. You can sort by date or payout.  You can click on any of those races and open them up in MixMaker.

Most Important Factors

Horse_Racing_Handicapping_Factors

Rank - Each factor is ranked from best (1) to worst (45).  When handicapping or creating a mix use the best factors from each group to find the most likely winner and contenders in the race you are handicapping.

Factor - This name of each handicapping factor.

Top 4 Ranked - This shows you the top 4 horses within that category.  In the example above, the best factor for predicting this race type is Last Late Pace, and the top for horses in that factor are 10,8,5,1.

Win % -  This tells you the percentage of time that the horse ranked on top for that factor ended up winning the race.  In the above example we are looking at a sample of 40 races, and the horse that ranked best for the factor TRAINER CURRENT MEET won 13 of 40 races (33%)
Place % - This tells you the percentage of times the top ranked horse ran at least 2nd.
Show % - This tells you the percentage of times the top ranked horse ran at least 3rd.
Accuracy - This number tells you how accurate the factor was.  A perfect score in accuracy would be 100 and that would mean that in every race, that factor had correctly predicted the top 4 finishers in order.  The more accurate a factor is (higher accuracy number) the more times you are likely to find the exacta, trifecta and superfecta in the top 4 horses.  Factors with high accuracy scores should be used if you are making exotic bets.  Factors with High Win%, High Accuracy and positive ROI are extremely important.
Win ROI - This shows you what you would have won or lost if you bet every top ranked horse for a factor to win.  In the example above, if you would have bet $2 to win on every horse ranked highest for Trainer Current Meet you would have made a profit of $26.00.  Many times you will see that a factor with a very high positive ROI has a low win %.  This will tell you that the factor has produced some longshot winners.  Over a 40 races, it may have only predicted 15% winners, but each of them may have been high odds horses that resulted in big win payouts. Conversely, low ROI and High Win % would indicate a lot of short priced winners (favorites).
Place ROI - This shows you what you would have won or lost if you bet every top ranked horse for a factor to place.
Show ROI - This shows you what you would have won or lost if you bet every top ranked horse for a factor to show.
TOP4 % - This tells you the percentage of times that a horse ranked within the to 4 in that factor wins the race.  In the example above you can see that for the factor Jockey Current Meet the Top 4 % is 82.  This means that in the group of similar races we are looking at, 82% of the time one of the top 4 horses in Jockey Current Meet will win this race type.  This is very useful information for betting Pick 3's, Pick 4's etc.
Advantage - this is the last column (abbreviated as ADV).  This shows you the point difference between the top ranked horse and the 2nd ranked horse for that factor. If the ADV is 0.0 that means that there is a tie and the top 2 horses have the same score for that factor.  Advantage is very useful to spot dominant horses. Sometimes you will see and advantage of 100, which means that the top ranked horse for that factor may be the only horse in the race with data. Maybe only one horse has started on turf, so he will have advantages of 100 in Turf Speed and Turf Earnings.  That may not be a useful advantage in a dirt race. However, pay very close attention to horses that have a big advantage in pace factors.  Especially if those factors also have high win, ROI and accuracy scores. Horses that are dominant within predictive factors should never be ignored.Watch A Tutorial Video for more information!