All posts by Matt O

MONDAY MYTHS: IS OHIO DERBY A GOOD SPOT FOR TRIPLE CROWN ALUMNI?


June 20, 2022 | By Jeremy Plonk/www.horseplayernow.com
Originally published on www.xpressbet.com

Welcome to a continuing handicapping series for our Monday blog space, “Monday Myths.” Each week I’ll use the power of the Betmix database to take common handicapping assumptions and either support or dispel them with data. Betmix data powers the 1/ST BET app and its features like Angler and Birddog give data-minded horseplayers a treasure trove of information in which to query your own curiosities.

Assumption:

Races like the Ohio Derby are prime landing spots for horses exiting the Triple Crown.

Background:

Saturday’s Ohio Derby will be one of the first regional Derby races offered after the Triple Crown, and these races often lure name players the public got acquainted through the Triple Crown. But are they good bets in this ‘re-set’ of races?

Data Points:

I fired up the Betmix database to look at all Ohio Derby entrants over the past 8 years, 77 in all. I separated those who exited Triple Crown starts and those who did not and compared records.

//

Non-Triple Crown Starters in the Ohio Derby
62: 4-13-19
6% Wins (2014, 2018, 2020, 2021)
$0.63 ROI
58% In The Money

Triple Crown Starters in the Ohio Derby
15: 4-3-5
27% Wins (2015, 2016, 2017, 2019)
$1.03 ROI
73% In The Money

Bottom line:

The Triple Crown alumni have less than one-quarter of the Ohio Derby starters over the past 8 years, yet are on equal footing in wins with a much higher win percentage (+21%). The Triple Crown starters also are more likely to finish in the money by 15% and have a much higher ROI (+$0.40) compared to non-Triple Crown starters. Even with non-Triple Crown horses winning the past 2 years in the Ohio Derby, the assumption that the Ohio Derby is a prime landing spot for TC alumni is true.

Additional details:

You can go into Betmix and run your own queries for a deeper dive into this theory and any that you can create. For instance, check out where each Ohio Derby starter has come from most recently in terms of both tracks and race classes.

Sharp Angle – Monmouth Stakes

Monmouth S. (G3) at Monmouth Park
9F on Turf (June 11)

Horse Racing Data Analyzed: Last 28 9-furlong graded turf stakes at Monmouth
Date Range: January 1, 2012 - Present
Sharp Angle: Ranked 1st in Last Late Pace
Factor Stats: 33 contenders, 9 winners (27%, $14.20 Win Return, 121 ROI%), 18 Place (54%), 21 show (63%)

Saturday's Monmouth Park card features four Stakes races that serve as auditions for Haskell Day next month at the Jersey Shore. Among the quartet of Stakes on Saturday is the Monmouth Stakes that drew a competitive field of a dozen middle-distance turf runners.

Angler tells that horses who have flashed good late speed in their previous start have been dangerous in this race type. This evidenced by the fact that horses ranking first in Last Late Pace have won 27% of the graded 9F turf stakes at Monmouth since 2012 while generating a $14.20 Win Return. They have also hit the board at a 63% clip.
Find this race in Betmix Birddog and use the Last Late Pace slider to see which horse ranks first in this factor. That’s the Sharp Angles play.

Want to look for your own Angles using Betmix handicapping software?
Click for the Betmix Angler tutorial
Click to subscribe to Betmix

MONDAY MYTHS: DO THE BIG BELMONT BARNS LOOK AHEAD TO SARATOGA?


June 13, 2022 | By Jeremy Plonk/www.horseplayernow.com
Originally published on www.xpressbet.com

Welcome to a continuing handicapping series for our Monday blog space, “Monday Myths.” Each week I’ll use the power of the Betmix database to take common handicapping assumptions and either support or dispel them with data. Betmix data powers the 1/ST BET app and its features like Angler and Birddog give data-minded horseplayers a treasure trove of information in which to query your own curiosities.

Assumption:

The pocket between the Belmont Stakes and the start of Saratoga is a place where the top barns reload for the summer.

Background:

Saturday’s Triple Crown closer at Belmont Park featured a bevy of top-class stakes races over several racing days. But with Saratoga still about 4+ weeks away, there’s a feeling among horseplayers that some of the biggest barns will be looking ahead to the Spa. Can that be quantified?

Data Points:

I fired up the Betmix database to look at late-season Belmont Park results over the past 4 years when Saratoga immediately followed (discounting the re-arranged 2020 pandemic seasons). I wanted to see if any of the heavyweight barns performed less-than-expected during that time. When looking at NYRA racing, Todd Pletcher, Chad Brown, Bill Mott, Christophe Clement and Shug McGaughey stand out with the highest-quality stables. I’ll use those as my benchmark.

//

2021
Pletcher 9-41 (22%)
Brown 9-45 (20%)
Mott 3-24 (12.5%)
Clement 6-49 (12%)
McGaughey 4-15 (27%)

//

2019
Pletcher 8-33 (24.2%)
Brown 7-42 (16.7%)
Mott 2-12 (16.7%)
Clement 8-34 (22.5%)
McGaughey 4-18 (22.2%)

//

2018
Pletcher 5-47 (10.6%)
Brown 13-74 (17.6%)
Mott 7-44 (15.9%)
Clement 14-51 (27.5%)
McGaughey 2-25 (8.0%)

//

2017
Pletcher 8-53 (15.1%)
Brown 16-78 (20.5%)
Mott 7-56 (12.5%)
Clement 9-48 (18.8%)
McGaughey 3-35 (8.6%)

Bottom line:
Todd Pletcher may have once been overlooking this time on the calendar, but his last 2 years indicate that’s not the case. Chad Brown has maintained a consistent 16-20% strike rate this time of year, but that’s definitely a cut below his normal Belmont output. Clement is coming off a down year, but previously was right on cue this time of year for his barn. McGaughey, like Pletcher, once may have been saving arsenal, but the last 2 years don’t give that impression.

To say outright that the top barns are awaiting Saratoga would be a generalization not based totally on the numbers. The increased purses on the NYRA circuit in racing years make it highly profitable no matter if it’s late Belmont or the Spa. Of the big players, Chad Brown would be the one to perhaps look at most consistently as a barn that’s awaiting Saratoga. But as the big swings show above, look at the immediate performance of these barns this week post-Belmont and you may find some horses to fade over the next few weeks.

Additional details:

You can go into Betmix and run your own queries for a deeper dive into this theory and any that you can create. For instance, check the classes of races and how these barns perform in the interim between the Belmont Stakes and Saratoga.

Sharp Angle – Belmont Stakes

Belmont S. (G1) at Belmont Park
12F on Dirt (June 11)

Horse Racing Data Analyzed: Last 8 Belmont Stakes
Date Range: January 1, 2012 - Present
Sharp Angle: Ranked 1st in Last E1 Pace
Factor Stats: 10 contenders, 4 winners (40%, $37.10 Win Return, 285 ROI%), 4 Place (40%, $7.10 Place Return), 5 show (50%, $7.70 Show Return)

Saturday's Belmont Stakes is known as the 'Test of Champions' due to its demanding mile and one half distance.

While stamina is surely needed to the get trophy in the Belmont, the Betmix Angler online handicapping database tells us that early speed is also key to winning this Classic.

Angler shows that 4 of the past 8 Belmont Stakes heroes ranked first in Last E1 Pace. While the two most recent Triple Crown champions, American Pharoah ($3.50) and Justify ($3.60) are among these winners, a pair of longshots round out the sample. 2013 winner Palace Malice returned $29.60 to his backers and a year later Tonalist paid $20.40.

This handicapping factor also pointed to Joevia, third in the 2019 Belmont at 21-1.

Find this race in Betmix Birddog and use the Last E1 Pace slider to see which horse ranks first in this factor. That’s the Sharp Angles play.

Want to look for your own Angles using Betmix handicapping software?
Click for the Betmix Angler tutorial
Click to subscribe to Betmix

Sharp Angles – Soaring Softly S. & Paradise Creek S.

Soaring Softly S. (G3) & Paradise Creek S. at Belmont Park
7F on Turf (May 28 & 29, 2022)

Horse Racing Data Analyzed: 56 7F turf stakes at Belmont Park
Date Range: January 1, 2012 - Present
Sharp Angle: Ranked 1st in Trainer Current Meet
Factor Stats: 61 contenders, 17 winners (27%, $49.20 Win Return, 140 ROI%), 27 Place (44%, $16.20 Place Return), 35 Show (57%)

There is huge buffet of stakes racing across North America this Memorial Day Weekend. Among them are a pair of relatively rare 7-furlong turf blacktype events at Belmont Park - the Grade 3 Soaring Softly for older females and the Paradise Creek for sophomore males.

A scan of the Betmix Angler online handicapping database found that the Trainer Current Meet handicapping factor has been quite predictive in these 7-furlong turf stakes at Belmont.

The hot trainer has won 27% of the time while generating a very nice $49.20 Win Return. Among the winners is last year´ s Soaring Softly heroine By Bye who returned $19 to her backers.

Want to look for your own Angles?
Click for the Betmix Angler tutorial
Click to subscribe to Betmix

Sharp Angles – Jim McKay Turf Sprint

Jim McKay S. at Pimlico
5F on Turf (May 21)

Horse Racing Data Analyzed: Last 30 5-furlong turf stakes at Pimlico
Date Range: January 1, 2012 - Present
Sharp Angle: Ranked 1st in Avg. Speed Last 3
Factor Stats: 36 contenders, 16 winners (44%, $8.80 Win Return, 112 ROI%), 22 place (61%, $7.40 Place Return), 27 show (75%, $7.70 Show Return)

The Jim McKay Turf Sprint honors the late, great ABC sportscaster and Maryland racing advocate and this year it serves as the lead-in to Preakness 147 on Saturday´´ s tremendous card at Old Hilltop.

The 5-furlong turf affair has drawn a salty field of 10 and tough turf sprint stakes like these are prime candidates for the big data handicapping analysis provided by the Betmix Angler online database.

Angler reveals that the Avg. Speed Last 3 handicapping factor has shown good results in this race type. Some 44% of the contenders ranking first in this factor have won and 75% have factored in the trifecta, all while generating plus Returns across the board.

Find this race in Betmix Birddog and use the Avg. Speed Last 3 slider to see which horse ranks first in this factor. That’s the Sharp Angles play.

Want to look for your own Angles using Betmix handicapping software?
Click for the Betmix Angler tutorial
Click to subscribe to Betmix

Sharp Angles – Peter Pan S.

Peter Pan S. (G3) at Belmont Park
9F on Dirt (May 14, 2022)

Horse Racing Data Analyzed: 21 9F dirt stakes at Belmont Park
Date Range: January 1, 2012 - Present
Sharp Angle: Ranked 1st in Avg. Speed Last 3
Factor Stats: 24 contenders, 14 winners (58%, $27.30 Win Return, 156 ROI%), 18 Place (75%, $7.00 Place Return), 20 Show (83%)

The Kentucky Derby may be in the rearview mirror but there are still some important 3-year-old stakes to be run this spring. Case in point is Saturday´ s Peter Pan Stakes at Belmont Park which has drawn field typical of the recent history of the race. This year´ s starting gate includes colts trying to run their way into the Belmont Stakes along with runners just trying to prove they belong at the graded stakes level.

With such an eclectic group we turned to the Betmix Angler online handicapping database and found that the Avg. Speed Last 3 handicapping factor has been quite predictive in the 9-furlong graded dirt stakes at Belmont.

Some 58% of the contenders have had their pictures taken while producing a $27.30 Win Return. And over 80% have factored in the trifecta. The winners include a trio of recent Peter Pan heroes - Unified ($3.10), Blended Citizen ($11.40) and Timeline ($2.90).

Want to look for your own Angles?
Click for the Betmix Angler tutorial
Click to subscribe to Betmix
MONDAY MYTHS: DO DERBY LONGSHOTS REPRODUCE AT PREAKNESS?


May 9, 2022 | By Jeremy Plonk/www.horseplayernow.com
Originally published on www.xpressbet.com

Welcome to a continuing handicapping series for our Monday blog space, “Monday Myths.” Each week I’ll use the power of the Betmix database to take common handicapping assumptions and either support or dispel them with data. Betmix data powers the 1/ST BET app and its features like Angler and Birddog give data-minded horseplayers a treasure trove of information in which to query your own curiosities.

Assumption:

Kentucky Derby longshots can’t be expected to reproduce in the Preakness.

Background:

With 80-1 shocker Rich Strike and 35-1 fourth-place finisher Simplification both expected to move from the Derby to the middle jewel in 2 weeks, skepticism abounds that they can replicate their success at Pimlico. Let’s see if that’s warranted.

Data Points:

I dialed up the Betmix database to look at each Preakness since 2013 to monitor how horses 15-1 or more from the Kentucky Derby performed in the Preakness. I looked not only at the horses who ran well in Louisville, but also those dismissed in the Derby at prices who decided to take a second swing where it may not have looked like the obvious move.

//

Horses 15-1 or more in the Derby have an 18: 2-2-3 record (11% win, 28% in the money) in the Preakness since 2013.
Horses less than 15-1 in the Derby have a 19: 4-4-2 record (21% win, 53% in the money) in the Preakness since 2013.

//

Horses 15-1 or more in the Derby have a $1.31 ROI for every $1 bet in the Preakness since 2013.
Horses less than 15-1 in the Derby have a $0.44 ROI for every $1 bet in the Preakness since 2013.

//

Horses 15-1 or more in the Derby have had 15.0-1 average off odds in the Preakness since 2013.
Horses less than 15-1 in the Derby have had 4.1-1 average off odds in the Preakness since 2013.

Bottom line:

Behind Oxbow and War of Will, Kentucky Derby longshots have more held their own winning two Preakness Stakes in the last 9 years, while horses like Bravazo, Ride on Curlin and Mylute have hit the board at Pimlico following big Derby odds. But the numbers strongly lean toward those under 15-1 in the Kentucky Derby in terms of volume and strike rates. Those horses are bet heavier, however, and the ROI on being faithful to the Derby big prices definitely has shown some short-term gain. This one has a mixed report card.

Additional details:

You can go into Betmix and run your own queries for a deeper dive into this theory and any that you can create. For instance, check out the Preakness runners in terms of Derby finishing positions and additional factors.

Pedigree Handicapping – Kentucky Derby & Oaks Sires

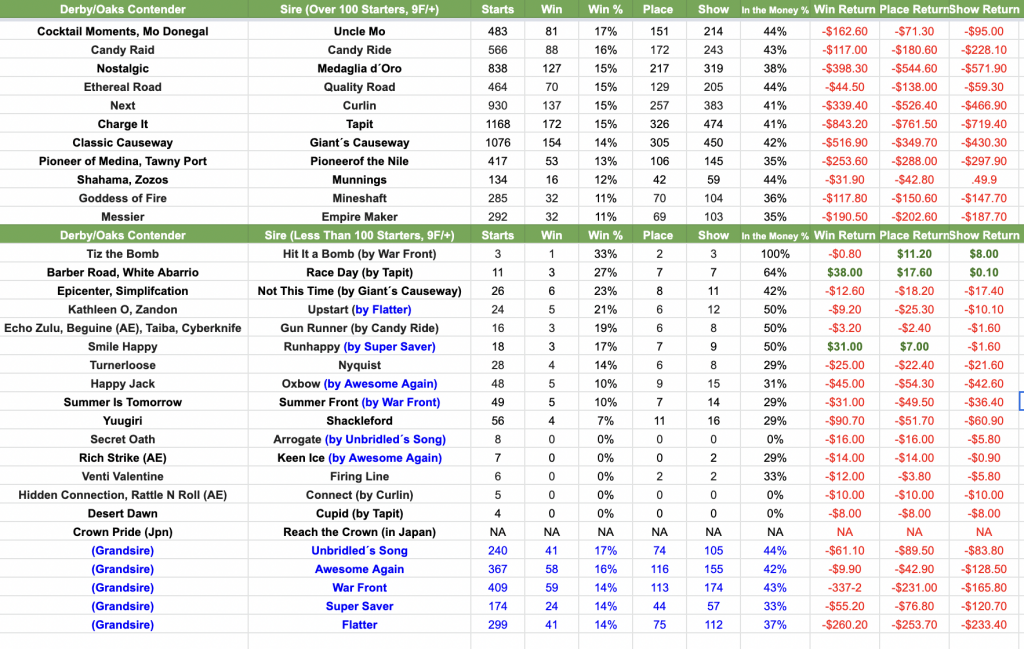
Who will like the distance? That´s an important question when handicapping this weekend´ s Classics for each sex. The Betmix Angler online handicapping database has a wealth of important data to help handicappers beat the races, including progeny stats for every sire with runners on this continent.

The chart below show the the progeny performance of sires with Derby or Oaks starters going 9-furlongs or longer. It´ s divided into two sets, stallions with over 100 distance starters and those below along with grandsires (shaded blue) when the actual sire has a low number of qualifying starters.

Fans of Mo Donegal and Cocktail Moments will be pleased to find that their sire, Uncle Mo, leads all "veteran" stallions with a 17% distance Win % and a 44% In The Money strike rate.

Not This Time and Gun Runner are the hottest young sires around and it appears their progeny are excelling as the trips get longer, from small sample sizes at least.

Best of luck on Derby weekend!

MONDAY MYTHS: ARE KEENELAND ALUMNI BET-AGAINSTS NEXT OUT?


April 25, 2022 | By Jeremy Plonk/www.horseplayernow.com
Originally published on www.xpressbet.com

Welcome to a continuing handicapping series for our Monday blog space, “Monday Myths.” Each week I’ll use the power of the Betmix database to take common handicapping assumptions and either support or dispel them with data. Betmix data powers the 1/ST BET app and its features like Angler and Birddog give data-minded horseplayers a treasure trove of information in which to query your own curiosities.

Assumption:

Horses are aimed to fire at Keeneland, and may not produce as well immediately after.

Background:

With Keeneland ending Friday, horseplayers will be posed with a choice to make upon their reappearances. Do you trust the form, or expect a decline after a premier, boutique meet?

Data Points:

I dialed up the Betmix database to look at all April/May/June starters nationally the past 5 seasons following a Keeneland Spring Meet. Specifically, how did Keeneland runners directly exiting that meet fair in their next start? I also looked at favorites exiting Keeneland whether the public’s trust in the meet performers was warranted.

//

Keeneland alumni won 13.5% in maiden claiming-level races in their next starts with a $0.64 ROI on every $1 bet. {13.2%, $0.77 for all non-Kee runners}.

Keeneland alumni won 14.0% in maiden special weight-level races in their next starts with a $0.72 ROI on every $1 bet. {13.0%, $0.71 for all non-Kee runners}

Keeneland alumni won 17.9% in claiming-level races in their next starts with a $0.83 ROI on every $1 bet. {13.8%, $0.76 for all non-Kee runners}

Keeneland alumni won 14.9% in allowance-level races in their next starts with a $0.78 ROI on every $1 bet. {14.2%, $0.76 for all non-Kee runners}

Keeneland alumni won 15.5% in stakes-level races in their next starts with a $1.02 ROI on every $1 bet. {12.9%, $0.77 for all non-Kee runners}

//

Keeneland alumni won 42.4% as maiden claiming favorites in their next starts with a $0.97 ROI for every $1 bet. {39.8%, $0.86 for all non-Kee favorites}

Keeneland alumni won 39.7% as maiden special weight favorites in their next starts with a $0.86 ROI for every $1 bet. {38.3%, $0.81 for all non-Kee favorites}

Keeneland alumni won 43.9% as claiming favorites in their next starts with a $0.98 ROI for every $1 bet. {37.4%, $0.83 for all non-Kee favorites}

Keeneland alumni won 36.5% as allowance favorites in their next starts with a $0.82 ROI for every $1 bet. {38.2%, $0.85 for all non-Kee favorites}

Keeneland alumni won 35.7% as stakes favorites in their next starts with a $0.80 ROI for every $1 bet. {41.6%, $0.77 for all non-Kee favorites}

Bottom line:

Keeneland alumni won at a higher percentage at all 5 class levels from 0.3% to 4.1% in span. The Keeneland alumni were more reliable winning favorites in maiden claiming, maiden special weight and claiming races, but not as reliable as allowance or stakes favorites next time. Overall, it’s clear that the Keeneland horses perform better than the general population next out, but the public’s misfires on favorites in higher-profile races appears to be the source of the reputation that Keeneland horses are aimed for that meet and vulnerable next out.

Additional details:

You can go into Betmix and run your own queries for a deeper dive into this theory and any that you can create. For instance, check out how the Keeneland alumni performed by specific tracks you follow.