Category Archives: Handicapping Blog

Sharp Angles – Peter Pan S.

Peter Pan S. (G3) at Belmont Park
9F on Dirt (May 14, 2022)

Horse Racing Data Analyzed: 21 9F dirt stakes at Belmont Park
Date Range: January 1, 2012 - Present
Sharp Angle: Ranked 1st in Avg. Speed Last 3
Factor Stats: 24 contenders, 14 winners (58%, $27.30 Win Return, 156 ROI%), 18 Place (75%, $7.00 Place Return), 20 Show (83%)

The Kentucky Derby may be in the rearview mirror but there are still some important 3-year-old stakes to be run this spring. Case in point is Saturday´ s Peter Pan Stakes at Belmont Park which has drawn field typical of the recent history of the race. This year´ s starting gate includes colts trying to run their way into the Belmont Stakes along with runners just trying to prove they belong at the graded stakes level.

With such an eclectic group we turned to the Betmix Angler online handicapping database and found that the Avg. Speed Last 3 handicapping factor has been quite predictive in the 9-furlong graded dirt stakes at Belmont.

Some 58% of the contenders have had their pictures taken while producing a $27.30 Win Return. And over 80% have factored in the trifecta. The winners include a trio of recent Peter Pan heroes - Unified ($3.10), Blended Citizen ($11.40) and Timeline ($2.90).

Want to look for your own Angles?
Click for the Betmix Angler tutorial
Click to subscribe to Betmix

MONDAY MYTHS: DO DERBY LONGSHOTS REPRODUCE AT PREAKNESS?


May 9, 2022 | By Jeremy Plonk/www.horseplayernow.com
Originally published on www.xpressbet.com

Welcome to a continuing handicapping series for our Monday blog space, “Monday Myths.” Each week I’ll use the power of the Betmix database to take common handicapping assumptions and either support or dispel them with data. Betmix data powers the 1/ST BET app and its features like Angler and Birddog give data-minded horseplayers a treasure trove of information in which to query your own curiosities.

Assumption:

Kentucky Derby longshots can’t be expected to reproduce in the Preakness.

Background:

With 80-1 shocker Rich Strike and 35-1 fourth-place finisher Simplification both expected to move from the Derby to the middle jewel in 2 weeks, skepticism abounds that they can replicate their success at Pimlico. Let’s see if that’s warranted.

Data Points:

I dialed up the Betmix database to look at each Preakness since 2013 to monitor how horses 15-1 or more from the Kentucky Derby performed in the Preakness. I looked not only at the horses who ran well in Louisville, but also those dismissed in the Derby at prices who decided to take a second swing where it may not have looked like the obvious move.

//

Horses 15-1 or more in the Derby have an 18: 2-2-3 record (11% win, 28% in the money) in the Preakness since 2013.
Horses less than 15-1 in the Derby have a 19: 4-4-2 record (21% win, 53% in the money) in the Preakness since 2013.

//

Horses 15-1 or more in the Derby have a $1.31 ROI for every $1 bet in the Preakness since 2013.
Horses less than 15-1 in the Derby have a $0.44 ROI for every $1 bet in the Preakness since 2013.

//

Horses 15-1 or more in the Derby have had 15.0-1 average off odds in the Preakness since 2013.
Horses less than 15-1 in the Derby have had 4.1-1 average off odds in the Preakness since 2013.

Bottom line:

Behind Oxbow and War of Will, Kentucky Derby longshots have more held their own winning two Preakness Stakes in the last 9 years, while horses like Bravazo, Ride on Curlin and Mylute have hit the board at Pimlico following big Derby odds. But the numbers strongly lean toward those under 15-1 in the Kentucky Derby in terms of volume and strike rates. Those horses are bet heavier, however, and the ROI on being faithful to the Derby big prices definitely has shown some short-term gain. This one has a mixed report card.

Additional details:

You can go into Betmix and run your own queries for a deeper dive into this theory and any that you can create. For instance, check out the Preakness runners in terms of Derby finishing positions and additional factors.

Pedigree Handicapping – Kentucky Derby & Oaks Sires

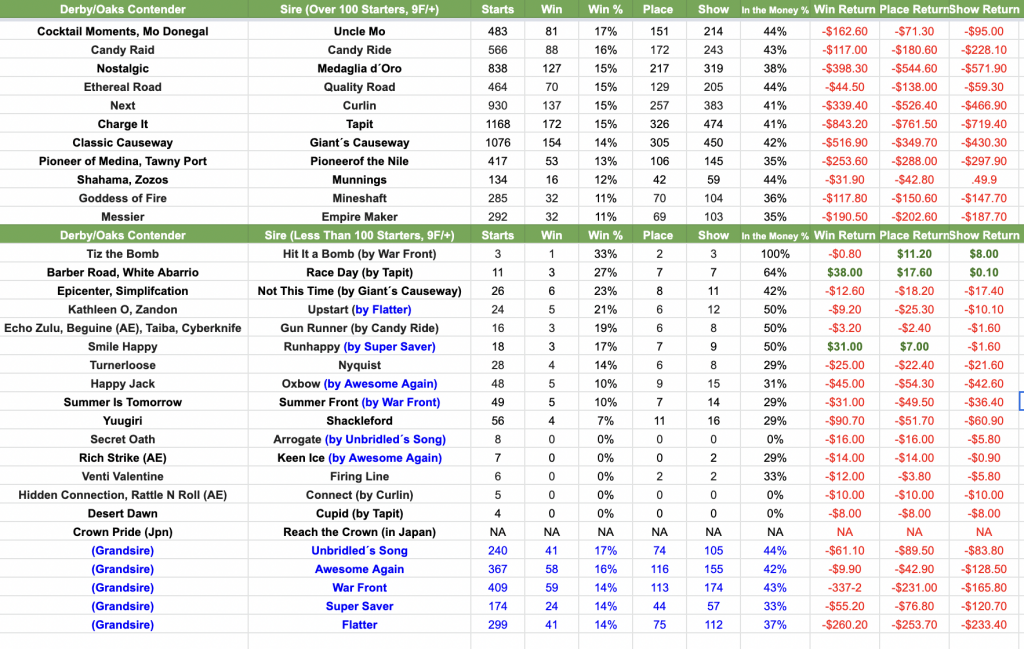
Who will like the distance? That´s an important question when handicapping this weekend´ s Classics for each sex. The Betmix Angler online handicapping database has a wealth of important data to help handicappers beat the races, including progeny stats for every sire with runners on this continent.

The chart below show the the progeny performance of sires with Derby or Oaks starters going 9-furlongs or longer. It´ s divided into two sets, stallions with over 100 distance starters and those below along with grandsires (shaded blue) when the actual sire has a low number of qualifying starters.

Fans of Mo Donegal and Cocktail Moments will be pleased to find that their sire, Uncle Mo, leads all "veteran" stallions with a 17% distance Win % and a 44% In The Money strike rate.

Not This Time and Gun Runner are the hottest young sires around and it appears their progeny are excelling as the trips get longer, from small sample sizes at least.

Best of luck on Derby weekend!

MONDAY MYTHS: ARE KEENELAND ALUMNI BET-AGAINSTS NEXT OUT?


April 25, 2022 | By Jeremy Plonk/www.horseplayernow.com
Originally published on www.xpressbet.com

Welcome to a continuing handicapping series for our Monday blog space, “Monday Myths.” Each week I’ll use the power of the Betmix database to take common handicapping assumptions and either support or dispel them with data. Betmix data powers the 1/ST BET app and its features like Angler and Birddog give data-minded horseplayers a treasure trove of information in which to query your own curiosities.

Assumption:

Horses are aimed to fire at Keeneland, and may not produce as well immediately after.

Background:

With Keeneland ending Friday, horseplayers will be posed with a choice to make upon their reappearances. Do you trust the form, or expect a decline after a premier, boutique meet?

Data Points:

I dialed up the Betmix database to look at all April/May/June starters nationally the past 5 seasons following a Keeneland Spring Meet. Specifically, how did Keeneland runners directly exiting that meet fair in their next start? I also looked at favorites exiting Keeneland whether the public’s trust in the meet performers was warranted.

//

Keeneland alumni won 13.5% in maiden claiming-level races in their next starts with a $0.64 ROI on every $1 bet. {13.2%, $0.77 for all non-Kee runners}.

Keeneland alumni won 14.0% in maiden special weight-level races in their next starts with a $0.72 ROI on every $1 bet. {13.0%, $0.71 for all non-Kee runners}

Keeneland alumni won 17.9% in claiming-level races in their next starts with a $0.83 ROI on every $1 bet. {13.8%, $0.76 for all non-Kee runners}

Keeneland alumni won 14.9% in allowance-level races in their next starts with a $0.78 ROI on every $1 bet. {14.2%, $0.76 for all non-Kee runners}

Keeneland alumni won 15.5% in stakes-level races in their next starts with a $1.02 ROI on every $1 bet. {12.9%, $0.77 for all non-Kee runners}

//

Keeneland alumni won 42.4% as maiden claiming favorites in their next starts with a $0.97 ROI for every $1 bet. {39.8%, $0.86 for all non-Kee favorites}

Keeneland alumni won 39.7% as maiden special weight favorites in their next starts with a $0.86 ROI for every $1 bet. {38.3%, $0.81 for all non-Kee favorites}

Keeneland alumni won 43.9% as claiming favorites in their next starts with a $0.98 ROI for every $1 bet. {37.4%, $0.83 for all non-Kee favorites}

Keeneland alumni won 36.5% as allowance favorites in their next starts with a $0.82 ROI for every $1 bet. {38.2%, $0.85 for all non-Kee favorites}

Keeneland alumni won 35.7% as stakes favorites in their next starts with a $0.80 ROI for every $1 bet. {41.6%, $0.77 for all non-Kee favorites}

Bottom line:

Keeneland alumni won at a higher percentage at all 5 class levels from 0.3% to 4.1% in span. The Keeneland alumni were more reliable winning favorites in maiden claiming, maiden special weight and claiming races, but not as reliable as allowance or stakes favorites next time. Overall, it’s clear that the Keeneland horses perform better than the general population next out, but the public’s misfires on favorites in higher-profile races appears to be the source of the reputation that Keeneland horses are aimed for that meet and vulnerable next out.

Additional details:

You can go into Betmix and run your own queries for a deeper dive into this theory and any that you can create. For instance, check out how the Keeneland alumni performed by specific tracks you follow.

Sharp Angle – King T. Leatherbury S.

King T. Leatherbury S. at Laurel 5.5F on Turf (April 23)
Horse Racing Data Analyzed: Last 50 5.5-furlong turf stakes at Laurel Park
Date Range: January 1, 2012 - Present
Sharp Angle: Ranked 1st in Avg. E1 Pace
Factor Stats: 56 contenders, 15 winners (26%, $86.20 Win Return 177 ROI%), 20 Place (35%, $9.10 Place Return), 26 Show (46%, $3.10 Show Return)

The Saturday card at Laurel featureS five stakes races, including the King T. Leatherbury Stakes that drew a tough field of 10 turf sprinters.

The Betmix Angler online handicapping database was made for difficult handicapping puzzles like this one so we ran a query to find if any handicapping factors have been predictive in this race type. Sure enough, Angler came back with a longshot angle (and play) in the race honoring the most prolific trainer in Maryland racing history.

Angler shows us that Avg. E1 Pace has produced 26% winners of the Laurel 5.5 furlong turf stakes going back 2012 while generating a whopping $86.20 Win Return.

This factor has pointed to quintet of double-digit winners, including 2019 Leatherbury hero Dirty ($13.00).

Find this race in Betmix Birddog and use the Avg. E1 Pace slider to see which horse ranks first in this factor. That’s the Sharp Angles play.

Want to look for your own Angles using Betmix handicapping software?
Click for the Betmix Angler tutorial
Click to subscribe to Betmix

MONDAY MYTHS: ARE TRIPLE CROWN TRAIL CLASS DROPPERS GOOD BETS?


April 18, 2022 | By Jeremy Plonk/www.horseplayernow.com
Originally published on www.xpressbet.com

Welcome to a continuing handicapping series for our Monday blog space, “Monday Myths.” Each week I’ll use the power of the Betmix database to take common handicapping assumptions and either support or dispel them with data. Betmix data powers the 1/ST BET app and its features like Angler and Birddog give data-minded horseplayers a treasure trove of information in which to query your own curiosities.

Assumption:

Three-year-olds dropping off the Triple Crown trail have a class advantage that wins allowance races.

Background:

With the slew of Triple Crown prep races nearly now all in the books, the successful runners move on to the main events. Those not successful will be seeking out more realistic spots for their gear-up to the rest of their careers, often in allowance races. But are those Triple Crown trail alumni really stockpiled in talent?

Data Points:

I dialed up the Betmix database to look at all April and May 3-year-old male allowance runners who last raced in a stakes, dating back 5 years to 2017. I wanted to see how successful they were in comparison to horses who were not coming out of the Triple Crown preps when matched up this time of year. I also wanted to see if those allowance horses bet to favoritism exiting the various class levels were any more or less trustworthy.

//

April & May 3YOs dropping from stakes to allowance won 16.6% with a $0.79 ROI for every $1 bet.
April & May 3YOs racing back in repeat allowance attempts won 14.7% with a $0.76 ROI for every $1 bet.
April & May 3YOs rising from maiden special weight to allowance attempts won 16.0% with a $0.79 ROI for every $1 bet.

//

April & May 3YOs dropping from stakes to allowance won 35.8% as favorites
April & May 3YOs racing back in repeat allowance attempts won 38.8% as favorites.
April & May 3YOs rising from maiden special weight to allowance attempts won 40.0% as favorites.

Bottom line:

Triple Crown trail stakes droppers won at a .6% higher rate in allowance races than maiden risers and 1.9% higher rate than those staying in the allowance ranks for a repeat effort. The Triple Crown trail droppers had an identical ROI to those rising from maiden races and both were $.03 better than allowance repeat runners. In terms of favorites, Triple Crown trail droppers were worst in the survey, 3 full percent below allowance repeaters and 4.2% lower than maiden risers bet to favoritism.

The numbers bear out that the Triple Crown trail class droppers aren’t any more profitable to bet, win at a negligible better rate, but are wrongly over-bet by the public in terms of favorites with the lowest rate.
Overall, the numbers say it’s a myth that the Triple Crown trail class droppers this time of year are strong allowance plays with any sort of advantage.

Additional details:

You can go into Betmix and run your own queries for a deeper dive into this theory and any that you can create. For instance, sort by tracks and races to see if any particular races historically have been better when its races’ also-rans drop into allowance company.

Sharp Angles – Lexington Stakes

Lexington S. (G3) at 8.5F on Dirt (April 14)
Horse Racing Data Analyzed: Last 49 8.5-furlong graded dirt stakes at Keeneland
Date Range: January 1, 2012 - Present
Sharp Angle: Ranked 1st in Avg. Lifetime Earnings
Factor Stats: 49 contenders, 18 winners (36%, $26.40 Win Return 126 ROI%), 25 Place (51%, $8.20 Place Return), 29 Show (59%)

Last call for Kentucky Derby contenders! That will be the underlying theme when the bugler calls 11 sophomore colts postward for the Lexington Stakes on Saturday afternoon at Keeneland.

It´ s been an exceptionally competitive Derby prep season, as evidenced by the fact that 40 qualifying points doesn´ t guarantee a spot in this year´ s Run for the Roses. Horseplayers face yet another handicapping challenge with this Lexington field so we turned to the Betmix Angler online handicapping database for insights.

Angler shows us that Avg. Lifetime Earnings has produced good results in this racetype at Keeneland, pointing to 36% winners of the 8.5-furlong graded dirt stakes since 2012, while generating a very healthy $26.40 Win Return.

Find this race in Betmix Birddog and use the Avg. Lifetime Earnings slider to see which horse ranks first in this factor. That’s the Sharp Angles play.

Want to look for your own Angles using Betmix handicapping software?
Click for the Betmix Angler tutorial
Click to subscribe to Betmix

MONDAY MYTHS: IS DERBY MORNING LINE MEANINGLESS AND OFFLINE?


April 11, 2022 | By Jeremy Plonk/www.horseplayernow.com
Originally published on www.xpressbet.com

Welcome to a continuing handicapping series for our Monday blog space, “Monday Myths.” Each week I’ll use the power of the Betmix database to take common handicapping assumptions and either support or dispel them with data. Betmix data powers the 1/ST BET app and its features like Angler and Birddog give data-minded horseplayers a treasure trove of information in which to query your own curiosities.

Assumption:

The Kentucky Derby morning line is a meaningless formality and does not reflect the final odds.

Background:

With the major preps in the books for the May 7 Kentucky Derby, the major focus for horseplayers now will be evaluating which horse at which price will catch their wagering dollar. While the morning line maker Mike Battaglia has been doing it for more than 40 years in the Run for the Roses, there’s still a wide swath of horseplayers critical of the projections and process.

Data Points:

I dialed up the Betmix database to look at the last 10 Kentucky Derby renewals and studied the morning line projected odds and the final off odds of its winners.

2012: I’ll Have Another | 12-1 ML, 15-1 off odds
2013: Orb | 7-2 ML, 5-1 off odds
2014: California Chrome | 5-2 ML, 5-2 off odds
2015: American Pharoah | 5-2 ML, 5-2 off odds
2016: Nyquist | 3-1 ML, 2-1 off odds
2017: Always Dreaming | 5-1 ML, 9-2 off odds
2018: Justify | 3 ML, 5-2 off odds
2019: Country House | 30 ML, 65 off odds
**2019: note disqualified winner Maximum Security | 9-2 ML, 9-2 off odds (not counted in our summary)**
2020: Authentic | 8 ML, 8 off odds
2021: Medina Spirit | 15 ML, 12 off odds

Bottom line:

Six times in 10 years, the Kentucky Derby morning line has been within 1 point of its off odds, 7 times within 1-1/2 points, 9 times within 3 points. In two of the “3-point” instances, I’ll Have Another and Medina Spirit were within a single click on the toteboard as the odds posted show from 12-1 to 15-1 in a single increment. The only wild distribution was Country House at 65-1 off odds from his 30-1 morning line, but it’s a rarity to have a Kentucky Derby contender lined at more than 30-1 out of a time-honored respect for connections entering horses in prestigious races and not embarrassing their horse. Right or wrong on that theory, and whether it applied in 2019, is not for data debate. What also is not for debate, based on the data, is the success of the morning line projections Battaglia has put forth. It’s a myth that the Derby morning line is meaningless and does not reflect the actual betting.

Additional details:

You can go into Betmix and run your own queries for a deeper dive into this theory and any that you can create. For instance, take a look at second, third-place finishers … or morning line favorites … in the Derby and see how they stack up. Do the same for the Preakness or Belmont.

Sharp Angles – Blue Grass S.

Blue Grass S. (G1) at Keeneland
9F on Dirt (April 9)

Horse Racing Data Analyzed: Last 9 Blue Grass Stakes
Date Range: January 1, 2012 - Present
Sharp Angle: Ranked 1st in Last Late Pace
Factor Stats: 10 contenders, 4 winners (40%, $15.60 Win Return, 178 ROI%), 6 place & show (60%, $3.60 Place Return & $1.30 Show Return)

The Blue Grass Stakes is back to being a Grade 1 and this year´ s field of 12 is certainly worthy of its restored top tier status. Of course, this doesn´ t make things any easier for horseplayers.

We took the Betmix Angler online handicapping database for a spin and found that Last Late Pace has pointed to 4 of the past 9 Blue Grass champs while generating a solid $15.60 Win Return along with plus figures in the Place and Show spots.

Two of those winners, Dance With Fate ($14.80) and Java´ s War ($11.20) came during the "All Weather" era that contributed to the temporary downgrade of the Blue Grass to a Grade 2. However, the last two Blue Grass winners, Art Collector ($6.60) and Essential Quality ($3.00), have also ranked first in this handicapping factor.

Find this race in Betmix Birddog and use the Last Late Pace slider to see which horse ranks first in this factor. That’s the Sharp Angles play.

Want to look for your own Angles using Betmix handicapping software?
Click for the Betmix Angler tutorial
Click to subscribe to Betmix


MONDAY MYTHS: ARE THERE FEWER SECRETS WITH APRIL 2-YEAR-OLDS?


April 4, 2022 | By Jeremy Plonk/www.horseplayernow.com
Originally published on www.xpressbet.com

Welcome to a continuing handicapping series for our Monday blog space, “Monday Myths.” Each week I’ll use the power of the Betmix database to take common handicapping assumptions and either support or dispel them with data. Betmix data powers the 1/ST BET app and its features like Angler and Birddog give data-minded horseplayers a treasure trove of information in which to query your own curiosities.

Assumption:

Early season 2-year-old races offer few surprises and the winners are often no secret.

Background:

With April comes the year’s first juvenile tests at tracks like Keeneland, Gulfstream, Aqueduct, Sunland and Turf Paradise traditionally the most prevalent of the baby races. Wesley Ward’s success at Keeneland is widely known as the dominant player in the division.

Data Points:

I dialed up the Betmix database to look at all April juvenile races since 2015, a total of 155 in all. I wanted to compare the average winning payouts and percentage of winning favorites to these races nationally compared to the general race population, as well as juvenile races run later in the year. Also, I looked at the obvious Wesley Ward factor vs. other juvenile race winners this time of year in April.

Findings:

The average win odds in 2-year-old April races since 2015 has been 3.6-1.
The average win odds in all April races since 2015 has been 4.7-1.
The average win odds of 2-year-old races May-December since 2015 has been 4.8-1.

//

The percentage of winning favorites in 2-year-old April races since 2015 has been 46.8%
The percentage of winning favorites in all April races since 2015 has been 36.8%
The percentage of winning favorites in 2-year-old May-December races since 2015 has been 36.5%

//

Trainer Wesley Ward’s April 2-year-olds have an average win odds of 0.8-1.
Trainer Wesley Ward’s percentage of winning favorites in 2-year-old April races since 2015 has been 52.1%. Non-Ward favorites win 42.5%

Bottom line:

The numbers speak for themselves in that April juvenile racing is far heavier toward favorites and shorter prices than the rest of the year and the rest of the month’s racing population. Win odds are a full point shorter, and the percentage of winning favorites 10% higher. Even when you factor out the obvious Wesley Ward influence in April, other national favorites still win at a rate about 6% higher than subsequent months and older horses within the same month. This myth is absolutely confirmed that secrets are hard to come by in April 2-year-old races.

Additional details:

You can go into Betmix and run your own queries for a deeper dive into this theory and any that you can create. For instance, which trainers besides Wesley Ward are worth your attention this early in the year with the freshman class?