Tag Archives: Betmix

X-Ray Button

Now you can get a much better picture of how each horse ranks in every handicapping factor.

The Factor Statistics section of BirdDog always showed how all the factors were ranked, from best to worst, and allowed you to sort based on things like Win%, ROI, etc. You could also see which horses were ranked in the top 4 for each of those factors.

If you wanted to see how every horse in the race was ranked, not just the top 4, or how closely ranked the horses were, you would have had to have given a value to the factor and look at the main table. Essentially you were creating a 1-factor mix for each factor you wanted to investigate.

Now, with the new X-RAY button you can see each factor with every horse ranked from best to worst and also see how closely they are ranked. You can also click on any horse number to isolate that horse within the rankings.

Have a look at this quick video to get more information about X-RAY and some ideas on how it can dramatically improve your handicapping.
Take a look at the new stuff in the Free Race Of The Day.

Sharp Angles – Breeders’ Cup First Look

Betmix Angler was introduced over the summer and has lived up the hype. It’s an extremely powerful handicapping tool, but one that does require a bit of trial and error to yielded consistent results. We’re kicking off a new blog series called Sharp Angles that will put the focus on some winning angles we’ve discovered by using Angler. By highlighting profitable angles, and the methodology behind them, we hope to advance the overall Angler understanding so that Betmix users can more effectively apply this important tool to their own handicapping challenges.

In three weeks time, the purple and gold Breeders Cup colors will adorn Santa Anita for the fourth time this decade. Two Breeders’ Cup contests, the Turf Sprint and Dirt Mile, are uniquely configured at the SoCal track so we’ve put those races in the Sharp Angles spotlight first.

turf-sprintBreeders' Cup Turf Sprint - 6.5 furlongs on the hillside turf course
Races Analyzed: 25 Graded Stakes races (including 2013 & 2014 Breeders’ Cup Turf Sprints)
Date Range: January 1, 2013 - October 14, 2016
Sharp Angle: Ranked 1st in Finish Position Rank
Factor Stats: Has won 11 of the 25 races (44%) for $106.80 Win ROI

This sample includes a $20-plus winner in each of the past three years - 2014 Las Cienegas Stakes heroine Tribal Spy, 2015 San Simeon Stakes winner Get Happy Mister ($27.20) and Holy Lute ($23.40) winner of a division of the Eddie D. Stakes on the opening day card of this year's fall meeting. Sharp form recent form does appear to be key in these ‘down the hill’ Graded events. We find that Speed Last Race has also been predictive, having been the winning factor in 9 of the 25 races (36%) and showing a $79 Win ROI.

Breeders' Cup Dirt Mile - 8 furlongs on the main track (around two turns)
Races Analyzed: 6 Grade 1 races (including 2013 & 2014 Breeders’ Cup Dirt Miles)
Date Range: January 1, 2013 - October 14, 2016
Sharp Angle: Ranked 1st in Best Speed Today’s Track
Factor Stats: Has won all 6 races (100%) for $25.6 Win ROI

This is obviously a small sample size and a relatively small ROI but it’s hard to argue with perfection. A look at some additional data also suggests this angle is on very solid ground. First of all, opening up the search to all Graded races at the mile distance would increase the sample by two more races and yield two more winners. Second, it does appear that ‘home track advantage’ is a strong indicator in this race type as Average Earnings Today’s Track (66%/$11 ROI) and Trainer Current Meet (66%/$12 ROI) are the next two winningest factors.

Want to look for your own angles?

Click for the Betmix Angler tutorial.

Click to subscribe to Betmix.

Angler Tips & Tricks

Some helpful new features have been added to Angler, and we have a new video that walks you through a few ways that you can use Angler to your advantage.

1. You can now click one button to see if any horses running today match any of your saved Angles, and print out the report.

2. Your Angles are now saved with their stats so you can sort through Win%, Win ROI etc.

Angler Tips & Tricks video

Learn how to use Angler to evaluate single horses in any race.

Learn how to create an Angle for a specific race type.

Learn how to create an Angle based on any condition or advantage...

Betmix Angler is Here!

To win consistently betting on horses you have to have an edge. Angler will give you the edge you need and so much more...

If you are serious about handicapping horses you need to know when a horse is a good bet, or a bad one. What types of races you should play and when to skip them. When a favorite is the right play and when to go against the chalk.

If you can describe the race or the horse, Angler can give you the percentages.

Q: How often do first time starters win MdSpWt races on the turf at Saratoga?
A: About 10% of the time.

Q: How often do horses in 6F dirt claiming races who are in poat #1, & have the best early pace & best speed last race win?
A: About 34% of the time.

Q: How often do horses win Allowance races after a layoff of 100 days or more?
A: About 11% of the time.

Q: How often do horses win Allowance races after a layoff of 100 days or more if they ran a bullet workout recently?
A: About 14% of the time.

Q: How often do horses win Allowance races after a layoff of 100 days or more if they ran a bullet workout recently, and have the top trainer & jockey at the meet?
A: About 35% of the time.

Find your profitable angles, save them and then look for them in today's or future races. Put your money in action when you know the odds and percentages are in your favor...

Angler is available to Betmix monthly or yearly subscribers, to learn more about Angler and how to use it please watch this video, or take a look at the help page.

Angler Odds vs. Performance Analysis

We've added some very informative new stats to Angler Analysis in BirdDog.

These new stats are all about letting you know how often horses, trainers, jockeys, etc. do what they are supposed to do. You need to know if the horse you are betting on has a history of doing what its supposed to do or not. When a horse does (or doesn't do) what is expected that can be good, bad or ugly.

If you bet a favorite to win or use it in your trifecta and it runs 5th that is a real ugly outcome.

However, if you bet against that favorite and it runs off the board that is a real good thing. The new stats described below will help you determine if your horse has a history of doing what you need it to do today.  Sometimes you want them to win, other times you want them to lose... What's good for me can be bad for you - it all depends on the bets we made.

To make money consistently you need to make value bets - bet on horses that have a better chance to win than the public thinks. That means finding horses, trainers, owners, jockeys, etc. that overperform and not betting on those that are likely to underperform.

The Angler Analysis tool gives you a lot of information about the horses, trainers, jockeys, sires, etc. in a race.

Below is a description of each of the columns and what they mean, the 4 new columns (11,12,13,14) are VERY informative.
  1. RACES - The number of races for the horse, trainer, etc. used in the sample.
  2. WIN $ - Shows you what your ROI would have been for betting this horse to win in each race. Positive ROI numbers are in green.
  3. Place $ - Shows you what your ROI would have been for betting this horse to place in each race. Positive ROI numbers are in green.
  4. Show $ - Shows you what your ROI would have been for betting this horse to show in each race. Positive ROI numbers are in green.
  5. WIN % - What percentage of the time did this horse (or trainer, jockey, etc.) win the race.
  6. Place % - What percentage of the time did this horse (or trainer, jockey, etc.) run at least second.
  7. WIN % - What percentage of the time did this horse (or trainer, jockey, etc.) ruin at least 3rd.
  8. The average finish position.
  9. The average off odds.
  10. The average odds for the horse (or trainer, jockey, etc.) when they win
 

The new data appears in columns 11,12,13 & 14. This info will give you a good indication of how often the horse (or trainer, jockey, owner, etc) does what it is supposed to do. This information is based on Angler data that looks at the "off odds" for each horse and how those odds are ranked.

In every race the horse that has the lowest odds is the favorite and that horse is ranked 1st in off odds. The longest shot in the race is ranked last.  A horse that goes off as the 1:9 favorite in a race is ranked 1st in off odds, a horse that goes off as the 2:1 favorite in another race is also ranked 1st in off odds. The actual odds don't matter here, just the rank - lowest odds are ranked 1st, horses with highest odds are ranked last.

In a perfect world the horse that is ranked 1st (lowest odds) should run 1st, and a horse that is ranked 4th (4th choice in odds) should run 4th. We all know that rarely happens, and these stats are designed to help you profit from that.

11 - HTB as Favorite.
Does the horse hit the board when its supposed to? If the horse is ranked 1, 2 or 3 in off odds (one of the top 3 betting choices) it should run 1st, 2nd or 3rd.  Looking at all of the races in the sample this shows you what % of the time the horse performs well when expected to.

12 - HTB not Favorite. Does the horse hit the board when its NOT supposed to? If the horse is ranked 4th or worse in off odds (not one of the top 3 betting choices) and it ends up running 1, 2 or 3 then it is running better than expected. Horses, trainers, jockeys, etc that have a high number in this column are potential longshots.  They have been underestimated in the past by the betting public and have hit the board when they were not expected to.
13 - OTB as Favorite. Shows you when the horse does NOT hit the board when its supposed to. If the horse is ranked among the top 3 betting choices and FAILS to run 1st, 2nd or 3rd you will see that percentage in this column. If a horse has a very high percentage in this column it is a "money burner".
14 - OTB. This shows you how often the horse does not hit the board and was not expected to hit the board (kind of a sad statistic). The horse is not expected to do well and it doesn't. If a horse has a big number here it lets you know that the horse is usually not a favorite and runs poorly.
This is a fantastic tool for spotting potential overlays and underlays, and also will help you decide when to pull the trigger on a potential longshot (horse often hits the board when its not expected to) or toss a vulnerable favorite (horse has shown that it will fail to HTB when it should).

This information is available in each table in Angler Analysis and really helps you to see which horses, jockeys, owners, trainers can do well when they should - and more importantly - do well when they are not supposed to.

Give Angler Analysis a try now: BirdDog Free Race

The full version of Angler should be ready early next week (knock on wood). If you are currently a subscriber to Betmix (monthly or yearly) then you will have access to Angler and Angler Analysis as part of your current subscription.

Starting August 1st, Angler and Angler Analysis will be part of the Betmix Pro subscription plan and will be offered at a higher subscription rate, so if you are currently not subscribed you might want to jump in now...

Betmix Angler

We've been hard at work on a fantastic new tool called "Angler".

An angle is simply a trend that has occurred in the past with enough frequency to be profitable that you use as a guide to find bets in the future. More on angles and Angler later....

Our Angler interface is not quite ready yet, but we have started mining that data, and have made some really neat stuff available to you in Bird Dog.
Click on the options tab in BirdDog:

Then put a check by "Angler Analysis"

When you add that widget to BirdDog you can grab a massive amount of data about the horses, trainers, jockeys, owners, sires, post positions and odds for the race you are looking at.

This table shows you information about what each horse in the race has done over the last 2 years.

Take a look at the first horse, #1 Favorite Coach.

He is in post #1, and has run 19 races over the last 2 years.

If you would have bet $2 to win on Favorite Coach in every one of his races you would have made a profit of $27.40.  He is a profitable horse for a bettor. If you would have bet $2 win on #6 Fleet Gold Digger in each of his 23 races you would have lost $39.60 - not a profitable horse.  Does this matter?  Are certain horses better spotted by their connections?  Does a profitable horse mean that it wins at big odds?  Are certain horses always over bet and never win?

If you spend a little time looking at the info in this table you can learn quite a bit.

Favorite Coach wins 21% of the time, runs at least 2nd 53% of the time and hits the board 68% of the time.  His average finish position is 2.95, his average odds are about 8:1 and when he wins he going off at about 7:1.

Angler Analysis will show you similar data for Trainers, Jockeys, Owners, Sires, Post, Off Odds, etc.

People are very familiar with Trainer and Jockey stats, but we are going to show you owner stats too. Do certain owners win more often than others?  Why is that? Is it just because they have a few good horses or is it because they manage their stables better?  Are they more involved with placing their horses in the right spots and hold their trainers more accountable for results?
Do you want to bet on a horse owned by someone who is a proven winner, or do you want to take your chances betting on a horse owned by someone who never seems to find the winner's circle?
So many questions...

If you want to win consistently betting on horses you need to be very curious. You should always be wondering why something happened and know what kind of chances you have with a particular horse.

BetMix Angler (Coming Soon!) will allow you to ask virtually any question you can think of and get an answer.  When you find a profitable "angle" you can save it and then find those situations when they occur in the future.

We have been working on Angler since early this year and we believe it will be the most valuable handicapping tool you will ever use.

ANGLER will be part of BETMIX PRO, a new subscription level that will be priced higher than our normal subscription rate.

But - if you are currently a subscriber to Betmix you will not be charged more to access Angler or to use the Angler Analysis widget in BirdDog.  As long as you are a subscriber in good standing you will get all of the benefits of Angler at your current subscription level.

Give it a try now:  BirdDog Free Race of the day


All new subscriptions through the month of July will also be upgraded to Betmix Pro, so if you are interested in what Angler can do and like what you see when you use the Angler Analysis widget then please become a monthly or yearly subscriber prior to August 1st so that you do not have to pay the higher rate for BetMix Pro.

Learn more about Angler Analysis and ANGLER in this video:

Betmix Tip – Handicapping Overview

There are many great tools in Betmix to help you handicap. Creating a mix (a group of factors and weights) that are specific to a race type is always going to be the best approach. Some people may find that process a bit confusing at first, so to help new users get out of the gate quickly with Betmix we have a very simple and visual tool called Handicapping Overview. You can use this great guide in any race in Betmix using the BirdDog interface.

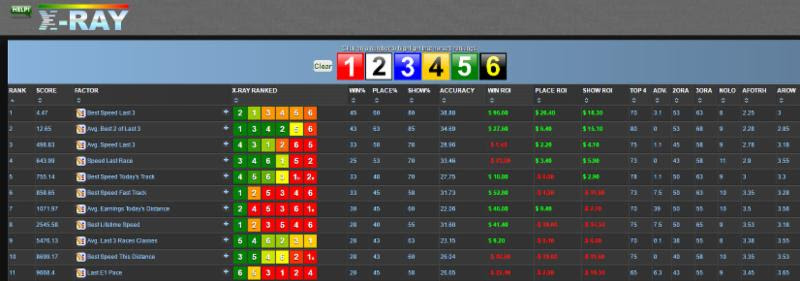
The Handicapping Overview will display the rankings of each horse in the race based on 19 different handicapping models. At the bottom of the chart all of those rankings are rolled up into a consensus with point totals.

image001

Top 10 – Uses a weighted blend of the 10 most important factors for the race type

Win% – Uses a weighted blend of the factors with the best win percentages

Hit The Board – Uses factors that predict high percentage of horses that ran 1, 2 or 3

Blend – Uses a mix of factors from each category (Speed, Pace, Earnings, etc.)

Longshot – Uses a mix based on factors with high win ROI numbers.

Overall Rankings – Uses the ideal setting from Overall Rankings. This is based on the setting that predicted the most exactas within the top 4 ranked horses of the sample of similar races.
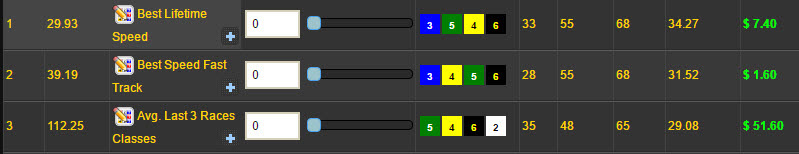
FACTOR GROUPS

These rankings will give you an idea of how the horses rank within each category using a weighted mix of the factors within that group. Factors that are more highly ranked within the group will be given more weight. You can click on the buttons the represent each factor to see the mix used. To the left of each Factor Group button you will see a “Signal Strength” icon that indicates how strong the factor group is in relation to the other groups. Four Green Bars in the icon is the best and means that the factors within that group are most important for the race type you are handicapping.

SCORE & BIRDDOG

The “Score” rankings are based on ranking the horses using the default factors in the main horse table:

Last Finish Position, Lengths Beaten, Speed Last Race and Class Difference. The score rankings are computed by looking at each horse's rank within each of those factors and they give you a solid look at horses most qualified to compete in today's race.

The “BirdDog” rankings use the top 10 factors from the BirdDog table. This table looks at a large number of similar races with the same amount of starters as the race you are handicapping. If you are handicapping a 6f dirt claiming race with 8 starters, the BirdDog stats will be based on a large group of races that were 6f dirt with exactly 8 starters. The BirdDog table lets you see how often a horse wins when ranked at a certain position. The BirdDog ranks takes the 10 best factors for the race type and computes a score from that.
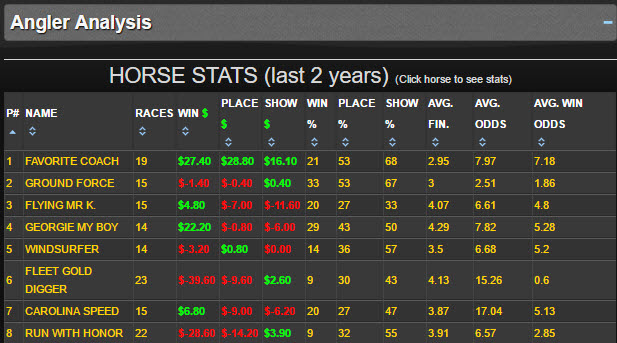
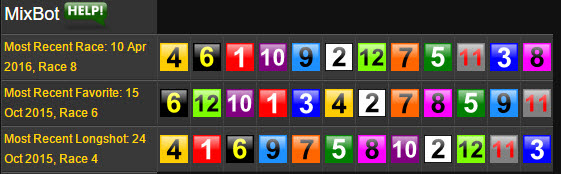
MixBot

The MixBot performs a few tasks for you very quickly. It searches the database for the most recent similar race (Track, distance, surface, class) and then runs MixMaker to find out how that race was optimally handicapped. It will then apply that mix to the race you are currently handicapping. It will then repeat the process for the most recent similar race won by a favorite, medium priced horse and most recent similar race won by a longshot. The results of these mixes will provide you with a very accurate way of looking at today's race.

COMBINED RANKINGS

The combined results of all of the rankings (Quick Handicapping, Factor Groups, Score & BirdDog)

BetMix Tip – PaceCast

We've added a neat new tool to BirdDog that lets you see how a race should unfold based on pace factors.
Its real easy to use, just click on the "Play All" button and you will see a simulation of the race looking at E1 (early), E2 (middle) and Late pace factors. Its a great way to see who might be on the lead early, and who should be running late.

This widget is found in BirdDog, to add it to your screen just click on the options icon and then select "BetMix PaceCast".

The simulation in PaceCast is based on several pace and speed factors for the race type you are handicapping.

Here's a quick video that explains PaceCast:

Give it a try now:  BirdDog Free Race of the day

Betmix Tip – BirdDog Handicapping Overview

We've added a few items to the Handicapping overview widget (found in BirdDog) that should make things a bit easier.

There are now check boxes by each section and group.  When something is checked it will be part of the consensus score, if it is not checked it will not be used.

We have also updated the MixBot section. You will see the mix for the most recent race, most recent favorite (paid under $6.00), most recent mid-range winner (paid between $6 - $15) and most recent longshot (paid over $15.00)

Take a look at this short video for more information:

Give it a try now:  BirdDog Free Race of the day


Betmix Tip – Mixbot

 If you are using Birddog, and the Handicapping Overview widget you will see some new information in the MixBot section.

The MixBot is performing a few tasks for you.  First of all it will search the database for the most recent similar race.  A similar race is one that was run at the same track, surface, distance and class as the one you are handicapping.

Once it finds that race it runs MixMaker to find the best Mix, then comes back and applies that mix to the current race for you. It will then put those rankings in the Handicapping Overview widget for you. The MixBot will then repeat the process, finding the most recent race won by a favorite (winner paid less than $6.00), and finally the most recent race won by a longshot (winner paid more than $15.00).

When you see the same horses showing up in the top spots for all three mix combinations you can be pretty confident in the selection.

Sometimes the most recent race will be the same as the most recent favorite or longshot race - if that happens then you will only see two lines of rankings in the MixBot section.

Give it a try now:  BirdDog Free Race of the day